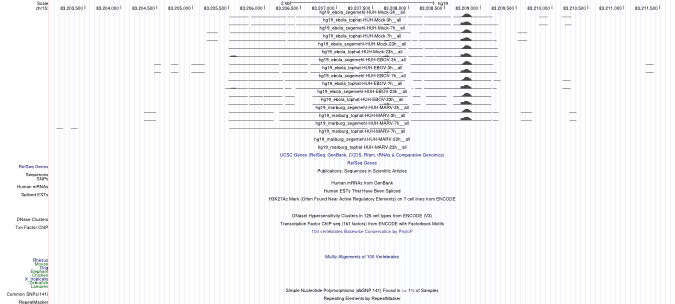
RPS17L
| Name | Synonyms | Full Name | RefSeq ID | Description (.pdf) | IGV-img (humangenome) | Sashimi-img (humangenome) | UCSC-img (humangenome) | IGV-img (batgenome) |
|---|---|---|---|---|---|---|---|---|
| RPS17L | NM_001199057, NP_001185986, P0CW22, RS17L_HUMAN |  |
 |
 |
Download all snapshots for IGV, UCSC and Sashimi (zip archive)
Description
Maximum read counts and DESeq normalized read counts for human and bat cell lines
| Source | Species | Mapping on | Mock3h | Mock7h | Mock23h | EBOV3h | EBOV7h | EBOV23h | MARV3h | MARV7h | MARV23h | |
|---|---|---|---|---|---|---|---|---|---|---|---|---|
Read_Max | H. sapiens | Genome | 1727 | 1945 | 854 | 1728 | 1640 | 1955 | 2336 | 2903 | 1061 | |
Read_Max | R. aegyptiacus | Transcriptome | 1275 | 920 | 902 | 1633 | 830 | 744 | 829 | 966 | 1049 | |
Read_Max | R. aegyptiacus | Genome | 0 | 0 | 0 | 0 | 0 | 0 | 0 | 0 | 0 | |
DESeq | H. sapiens | Genome | 344.0 | 32.62 | 3.98 | 178.95 | 14.82 | 347.09 | 382.58 | 93.72 | 197.81 | |
DESeq | R. aegyptiacus | Transcriptome | 3058.2 | 2333.7 | 2136.9 | 3361.4 | 2099.5 | 2309.4 | 2213.3 | 2437.3 | 2875.8 | |
DESeq | R. aegyptiacus | Genome | 0.0 | 0.0 | 0.0 | 0.0 | 0.0 | 0.0 | 0.0 | 0.0 | 0.0 |