Contents
- ES 1: Data
- ES 2: Differential gene expression (DGE)
- ES 2A: Hierarchical clustering
- ES 2B: Overview
- ES 2C: Timepoints
- ES 2D: Contrasts
- ES 2E: Human vs Bat cells
- ES 2F: Human vs Filovirus with replicates
- ES 2G: Human vs Bat cells with replicates
- ES 2H: De novo genes
- ES 2I: ncRNAs
- ES 3: Genes viewer
- ES 3A: protein-coding genes and ncRNAs
- ES 3B: de novo genes
- ES 4: Common genes during filovirus infection
- ES 4A: Summary (PDF)
- ES 4B: Scatterplots
- ES 4C: Group plots (time series)
- ES 5: MARA analysis of transcription factors and binding sites
- ES 5A: EBOV and MARV
- ES 5B: EBOV only
- ES 5C: MARV only
- ES 5D: Summary (PDF)
- ES 6: Pathways
- ES 7: qRT-PCR
- ES 7A: Primer design
- ES 7B: qRT-PCR results
- ES 7C: Melt curves
- ES 7D: Gels
- ES 7E: IFA of second experiment
Download Supplemental Material: pdf (~1.6MB)
ES 1A: Samples and Libraries
All reads were preprocessed for quality, 5'-bias and poly-A tails. Preprocessed HiSeq libraries for HuH7 and R06E-J samples were pooled for assembly.
Additionally, all nine R06E-J samples were pooled and sequenced on a single MiSeq lane with a length of 300 bp and in paired-end mode. Read coverage was calculated on an expected eukaryotic transcriptome size of 75 Mbp.
| Sample | Read Numbers | Coverage | FastQC read statistics | |||
|---|---|---|---|---|---|---|
| raw | trimmed | raw | trimmed | raw | trimmed | |
| HuH7: HiSeq Samples | ||||||
| HuH7-MOCK-3h | 40,529,770 | 38,408,644 | 54X | 51X | forward,reverse | forward,reverse |
| HuH7-MOCK-7h | 38,008,320 | 35,958,522 | 51X | 48X | forward,reverse | forward,reverse |
| HuH7-MOCK-23h | 39,006,442 | 36,866,384 | 52X | 49X | forward,reverse | forward,reverse |
| HuH7-EBOV-3h | 34,429,922 | 32,777,274 | 46X | 44X | forward,reverse | forward,reverse |
| HuH7-EBOV-7h | 49,982,536 | 46,619,978 | 67X | 62X | forward,reverse | forward,reverse |
| HuH7-EBOV-23h | 53,034,360 | 50,112,880 | 71X | 67X | forward,reverse | forward,reverse |
| HuH7-MARV-3h | 44,197,622 | 41,778,332 | 59X | 56X | forward,reverse | forward,reverse |
| HuH7-MARV-7h | 48,264,544 | 45,678,616 | 64X | 61X | forward,reverse | forward,reverse |
| HuH7-MARV-23h | 36,284,714 | 34,261,494 | 48X | 46X | forward,reverse | forward,reverse |
| HuH7-Pooled | 382,332,302 | 362,462,124 | 510X | 483X | forward,reverse | forward,reverse |
| R06E-J: HiSeq Samples | ||||||
| R06E-J-MOCK-3h | 50,396,276 | 47,815,138 | 67X | 64X | forward,reverse | forward,reverse |
| R06E-J-MOCK-7h | 44,016,800 | 41,351,362 | 59X | 55X | forward,reverse | forward,reverse |
| R06E-J-MOCK-23h | 48,464,382 | 45,474,028 | 65X | 61X | forward,reverse | forward,reverse |
| R06E-J-EBOV-3h | 41,450,606 | 39,376,162 | 55X | 53X | forward,reverse | forward,reverse |
| R06E-J-EBOV-7h | 38,362,126 | 36,005,676 | 51X | 48X | forward,reverse | forward,reverse |
| R06E-J-EBOV-23h | 39,292,722 | 37,350,338 | 52X | 50X | forward,reverse | forward,reverse |
| R06E-J-MARV-3h | 37,490,486 | 35,538,058 | 50X | 47X | forward,reverse | forward,reverse |
| R06E-J-MARV-7h | 48,645,544 | 45,862,636 | 65X | 61X | forward,reverse | forward,reverse |
| R06E-J-MARV-23h | 45,569,356 | 43,291,468 | 61X | 58X | forward,reverse | forward,reverse |
| R06E-J-Pooled | 393,021,564 | 372,082,040 | 524X | 496X | forward,reverse | forward,reverse |
| R06E-J: MiSeq Sample | ||||||
| R06E-J-MiSeq | 38,163,200 | 38,028,488 | 153X | 152X | forward,reverse | forward,reverse |
ES 1B: De novo transcriptome assembly of Rousettus aegyptiacus
| Assembly | Contigs | Contigs >1000 bp | max. Contig (bp) | Parameter | Download (*.tar.gz) |
|---|---|---|---|---|---|
| Velvet/Oases* | 370,200 | 180,458 | 36,073 | k = 45,55,65,75; multiple kmer-assemblies of Velvet merged by Oases like described in manual | link (95 Mb) |
| SoapDenovo-Trans* | 699,418 | 147,144 | 34,307 | k = 25,35,45,55,65,75; multiple kmer-assemblies merged by cd-hit-est (-c 0.95) | link (189 Mb) |
| Trinity* | 484,826 | 188,534 | 30,056 | k = 25 (fix) | link (172 Mb) |
| ABySS/TransABySS* | 790,204 | 169,324 | 21,424 | k = 25,35,45,55,65,75; multiple kmer-assemblies of ABySS merged by TransABySS pipeline | link (192 Mb) |
| Mira** | 162,861 | 21,987 | 14,119 | overlap graph approach; job = est,denovo,accurate | link (33 Mb) |
| Clustered (cd-hit-est) | 977,787 | 277,595 | 36,073 | -c 0.95 | link (290 Mb) |
* 9 different samples were sequenced individually on a Illumina HiSeq with 100bp, paired end; after sequencing pooled for assembly
** all 9 samples were pooled and normalized before library preparation, then sequenced on a Illumina MiSeq, 300bp, paired end
QUAST: full report statistics
ES 2A: Hierarchical clustering of log2 gene-expression fold-changes upon infection of human cells with EBOV or MARV
Hierarchical clustering of log2 gene-expression fold-changes upon infection with EBOV or MARV, respectively. Deregulated genes (padj < 0.1) with an absolute log2 expression fold-change greater than five in at least one of the contrasts (infection versus Mock control at a specific time point post infection, p.i.) have been considered for hierarchical clustering of log2 gene expression fold changes.

ES 2B: Differential gene expression: Overview
Pairwise ComparisonsOverview of different comparisons within human (bat) samples and between the two species. Click on button to see all comparisons and links to the corresponding tables with all differential expressed genes with a padj < 0.1. Same colors indicate that the results are listed in the same table.
| MOCK-3h | MOCK-7h | MOCK-23h | EBOV-3h | EBOV-7h | EBOV-23h | MARV-3h | MARV-7h | MARV-23h | |
| MOCK-3h | |||||||||
| MOCK-7h | |||||||||
| MOCK-23h | |||||||||
| EBOV-3h | |||||||||
| EBOV-7h | |||||||||
| EBOV-23h | |||||||||
| MARV-3h | |||||||||
| MARV-7h | |||||||||
| MARV-23h |
Comparisons including Replicates
Overview of different comparisons between Mock and filovirus (EBOV, MARV) samples using replicates. Click on button to see all comparisons and links to the corresponding tables with all differential expressed genes filtered by a padj <= 0.05. Same colors indicate that the results are listed in the same table.
- MOCK = MOCK-3h, MOCK-7h and MOCK-23h as replicates
- FILO-xh = EBOV-xh, MARV-xh as replicates
| MOCK | FILO-3h | FILO-7h | FILO-23h | |
| MOCK | ||||
| FILO-3h | ||||
| FILO-7h | ||||
| FILO-23h |
ES 2C: Comparisons between time points 3h, 7h and 23h of Mock, EBOV and MARV samples within human and bat
Differential gene expression of HuH7/R06E-J MOCK, EBOV and MARV samples compared at 3h, 7h and 23h, respectively. These tables show the differential expression within MOCK, EBOV and MARV and between the different time points, separate for human and bat. Tables are sorted by fold change.
- HuH7 Mock|EBOV|MARV
- R06E-J Mock|EBOV|MARV
ES 2D: Differential gene expression: Comparisons between Mock, EBOV and MARV samples
All tables are sorted by fold change.
| Comparison | Table link | Download table | Description |
|---|---|---|---|
| HuH7 Mock/EBOV @3h,7h,23h |
Go | click | Differential gene expression of HuH7 MOCK and EBOV samples compared at 3h, 7h and 23h post infection. |
| HuH7 Mock/MARV @3h,7h,23h |
Go | click | Differential gene expression of HuH7 MOCK and MARV samples compared at 3h, 7h and 23h post infection. |
| HuH7 EBOV/MARV @3h,7h,23h |
Go | click | Differential gene expression of HuH7 EBOV and MARV samples compared at 3h, 7h and 23h post infection. |
| R06E-J Mock/EBOV @3h,7h,23h |
Go | click | Differential gene expression of R06E-J MOCK and EBOV samples compared at 3h, 7h and 23h post infection. |
| R06E-J Mock/MARV @3h,7h,23h |
Go | click | Differential gene expression of R06E-J MOCK and MARV samples compared at 3h, 7h and 23h post infection. |
| R06E-J EBOV/MARV @3h,7h,23h |
Go | click | Differential gene expression of R06E-J EBOV and MARV samples compared at 3h, 7h and 23h post infection. |
ES 2E: Comparisons between human and bat
We compared differential expression between human and bat EBOV and MARV infected samples at 3h, 7h and 23h poi. Additionally, we used EBOV and MARV samples at same time points as replicates with DESeq to compare the characteristics of filovirus infection between human and bat.
- HuH7 EBOV 3h,7h,23h compared with R06E-J EBOV 3h,7h,23h
- HuH7 MARV 3h,7h,23h compared with R06E-J MARV 3h,7h,23h
- HuH7 EBOV+MARV 3h,7h,23h compared with R06E-J EBOV+MARV 3h,7h,23h
ES 2F: Human MOCK samples compared to EBOV+MARV cells using replicates
Differential gene expression of HuH7 MOCK samples (3h, 7h and 23h as replicates) compared to EBOV+MARV samples (as replicates, called FILO) at 23h. For 3h and 7h no differential expressed genes were found with a padj < 0.05.
- HuH7 MOCK3h,7h,23h vs. HuH7 FILOEBOV-23h,MARV-23h
ES 2G: Human vs Bat samples including replicates
Differential gene expression of HuH7 MOCK/EBOV/MARV samples compared to R06E-J MOCK/EBOV/MARV samples at 3h, 7h and 23h (filtered by a padj < 0.05). Within this experiment we compared:
- HuH7 MOCK3h,7h,23h vs R06E-J MOCK3h,7h,23h
- HuH7 FILOEBOV-3h,MARV-3h vs R06E-J FILOEBOV-3h,MARV-3h
- HuH7 FILOEBOV-7h,MARV-3h vs R06E-J FILOEBOV-7h,MARV-3h
- HuH7 FILOEBOV-23h,MARV-3h vs R06E-J FILOEBOV-23h,MARV-3h
- MOCK Filtered: HuH7 FILOEBOV-3h,MARV-3h vs R06E-J FILOEBOV-3h,MARV-3h
- MOCK Filtered: HuH7 FILOEBOV-7h,MARV-3h vs R06E-J FILOEBOV-7h,MARV-3h
- MOCK Filtered: HuH7 FILOEBOV-23h,MARV-3h vs R06E-J FILOEBOV-23h,MARV-3h
ES 2H: Comparison of de novo predicted gene loci of human and bat
We used the first step of the Cufflinks pipeline to detect possible gene loci de novo based on Tophat mapped read data. We further compared the differential expression on each gene loci between different time points and within one condition as well as at same time points and different conditions. All results for human and bat (norm. read counts, log2 fold changes, padj) are listed in the following tables, respectively.
- Human
- Bat
ES 2I: Comparison of ncRNA genes within human and bat
We compared the differential expression of each ncRNA between different time points and within one condition as well as at same time points and different conditions. All results for human and bat (norm. read counts, log2 fold changes, padj) are listed in the following tables, respectively.
- Human
- Bat
ES 4: Common genes during filovirus infection
ES 4A: Summary download (pdf)
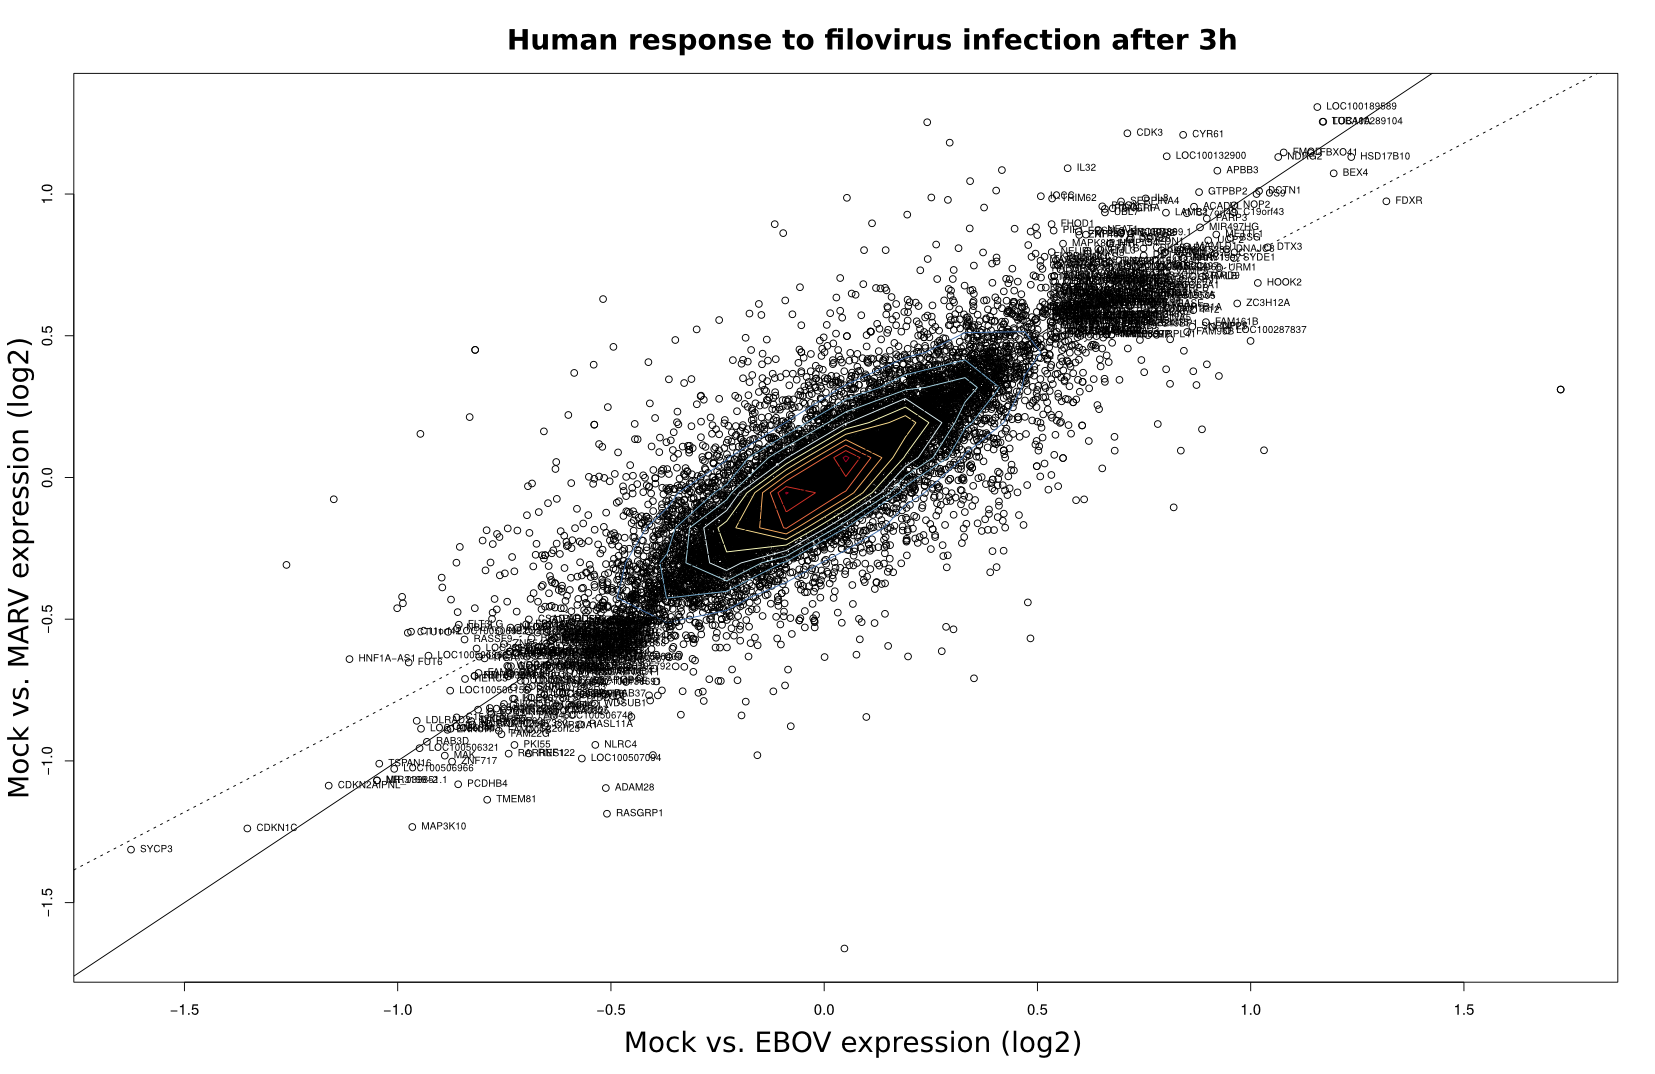
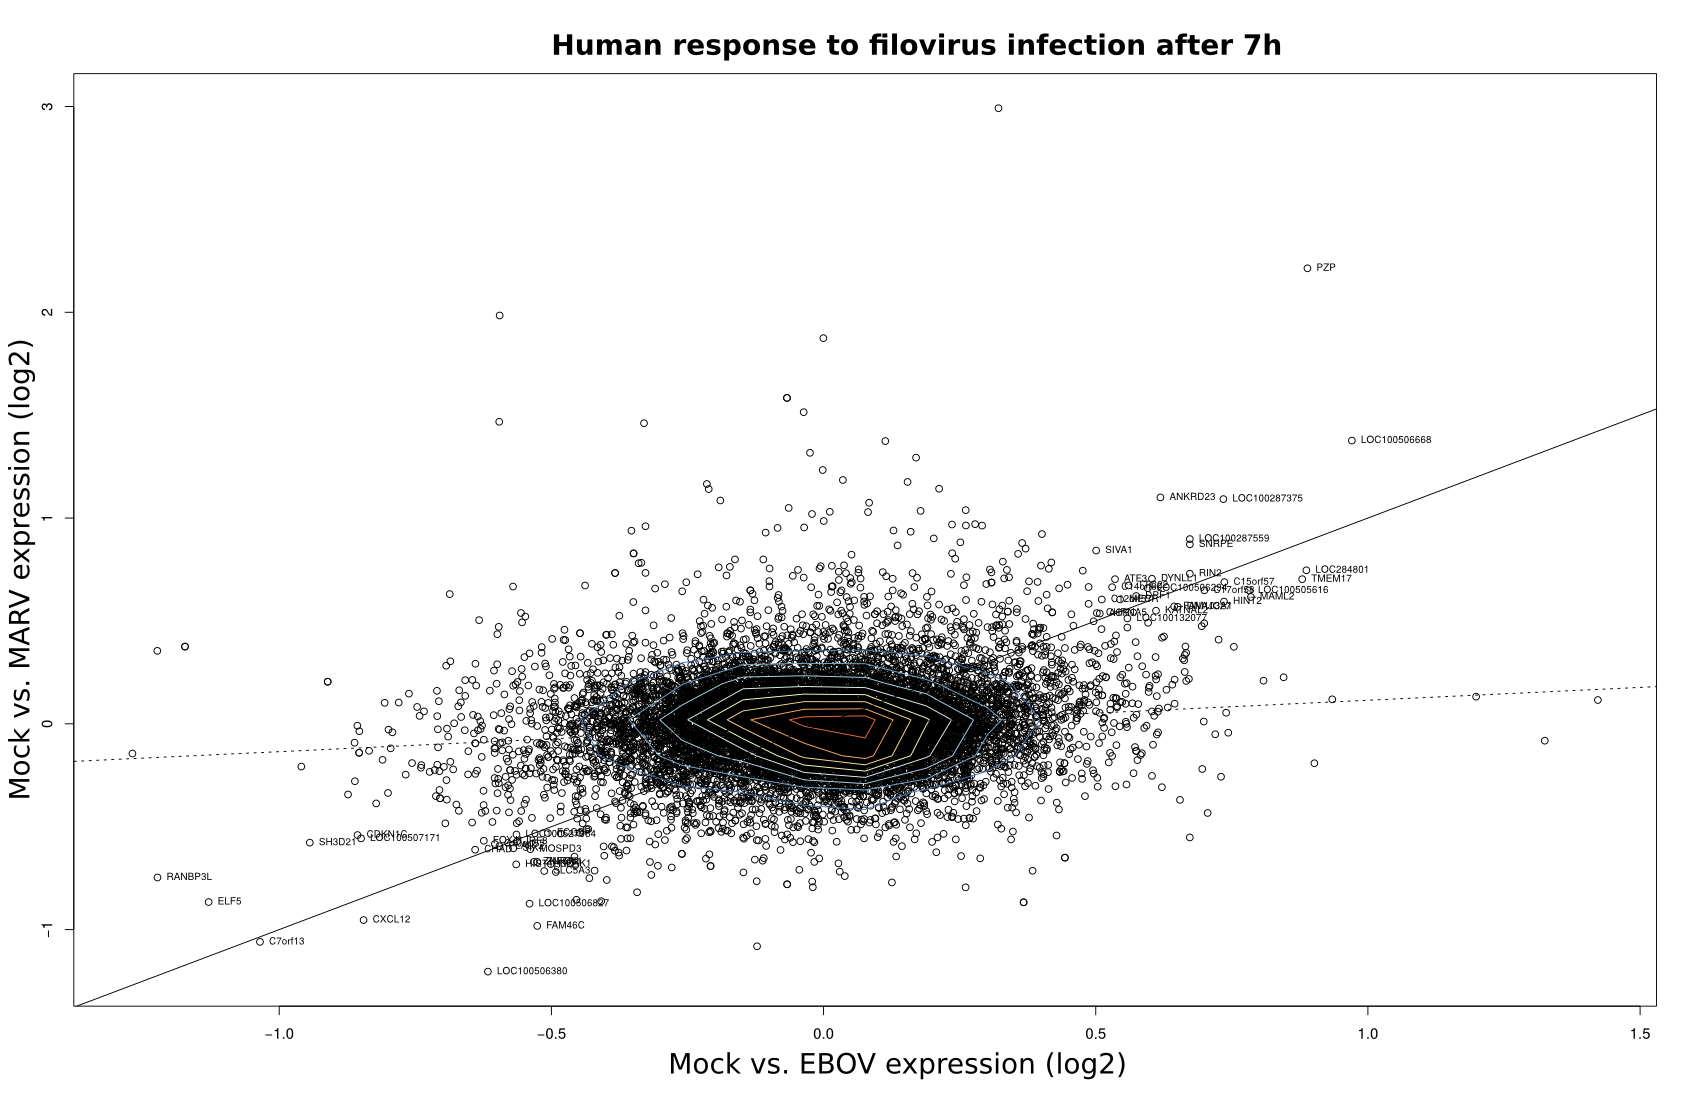
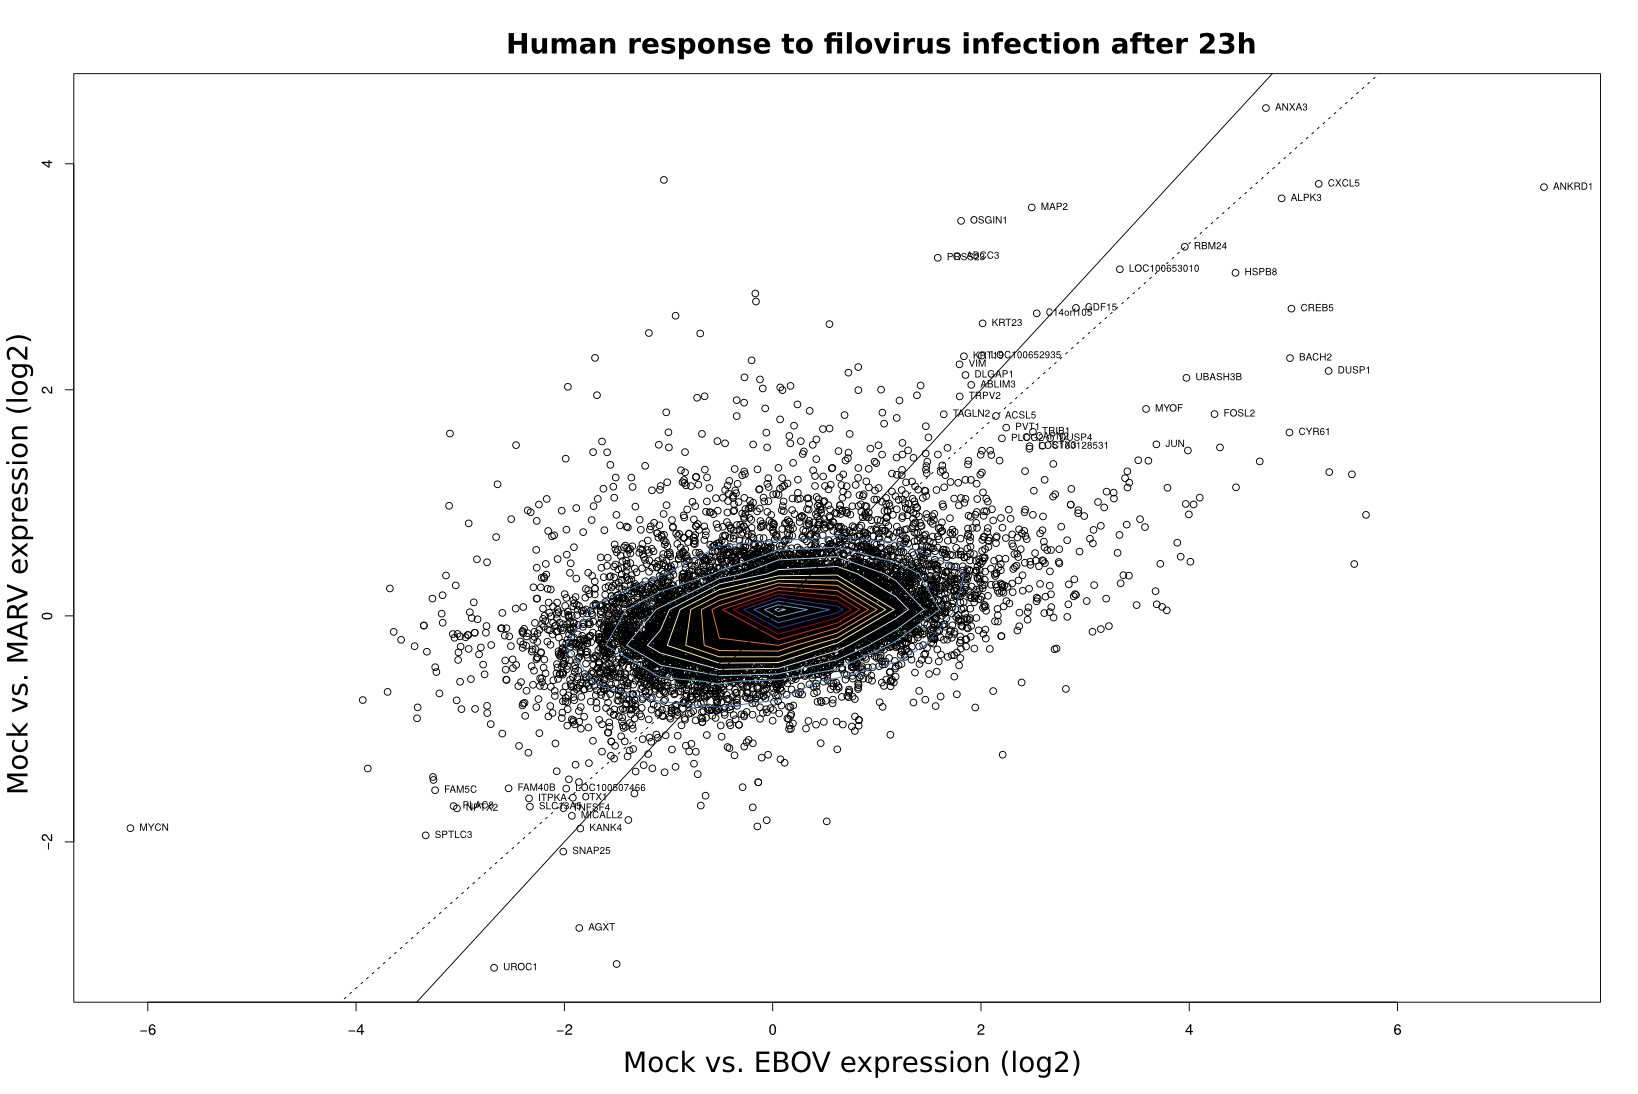
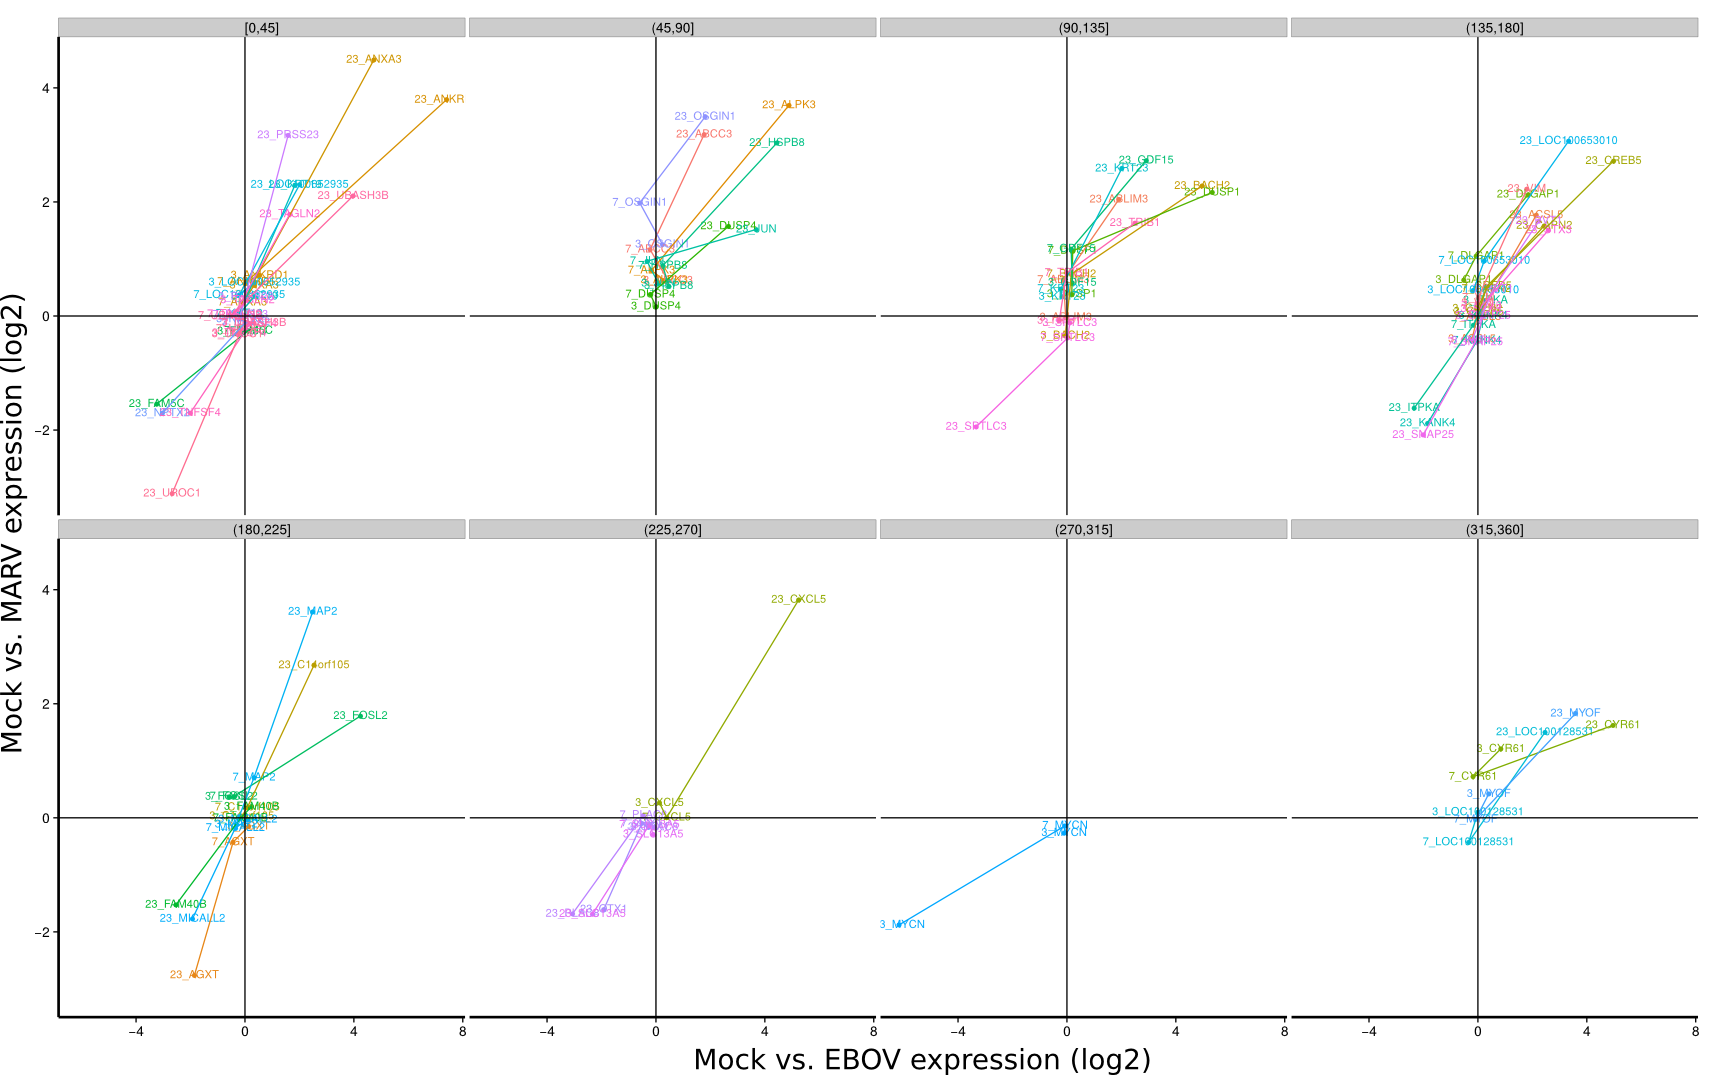
ES 4B: Scatterplots
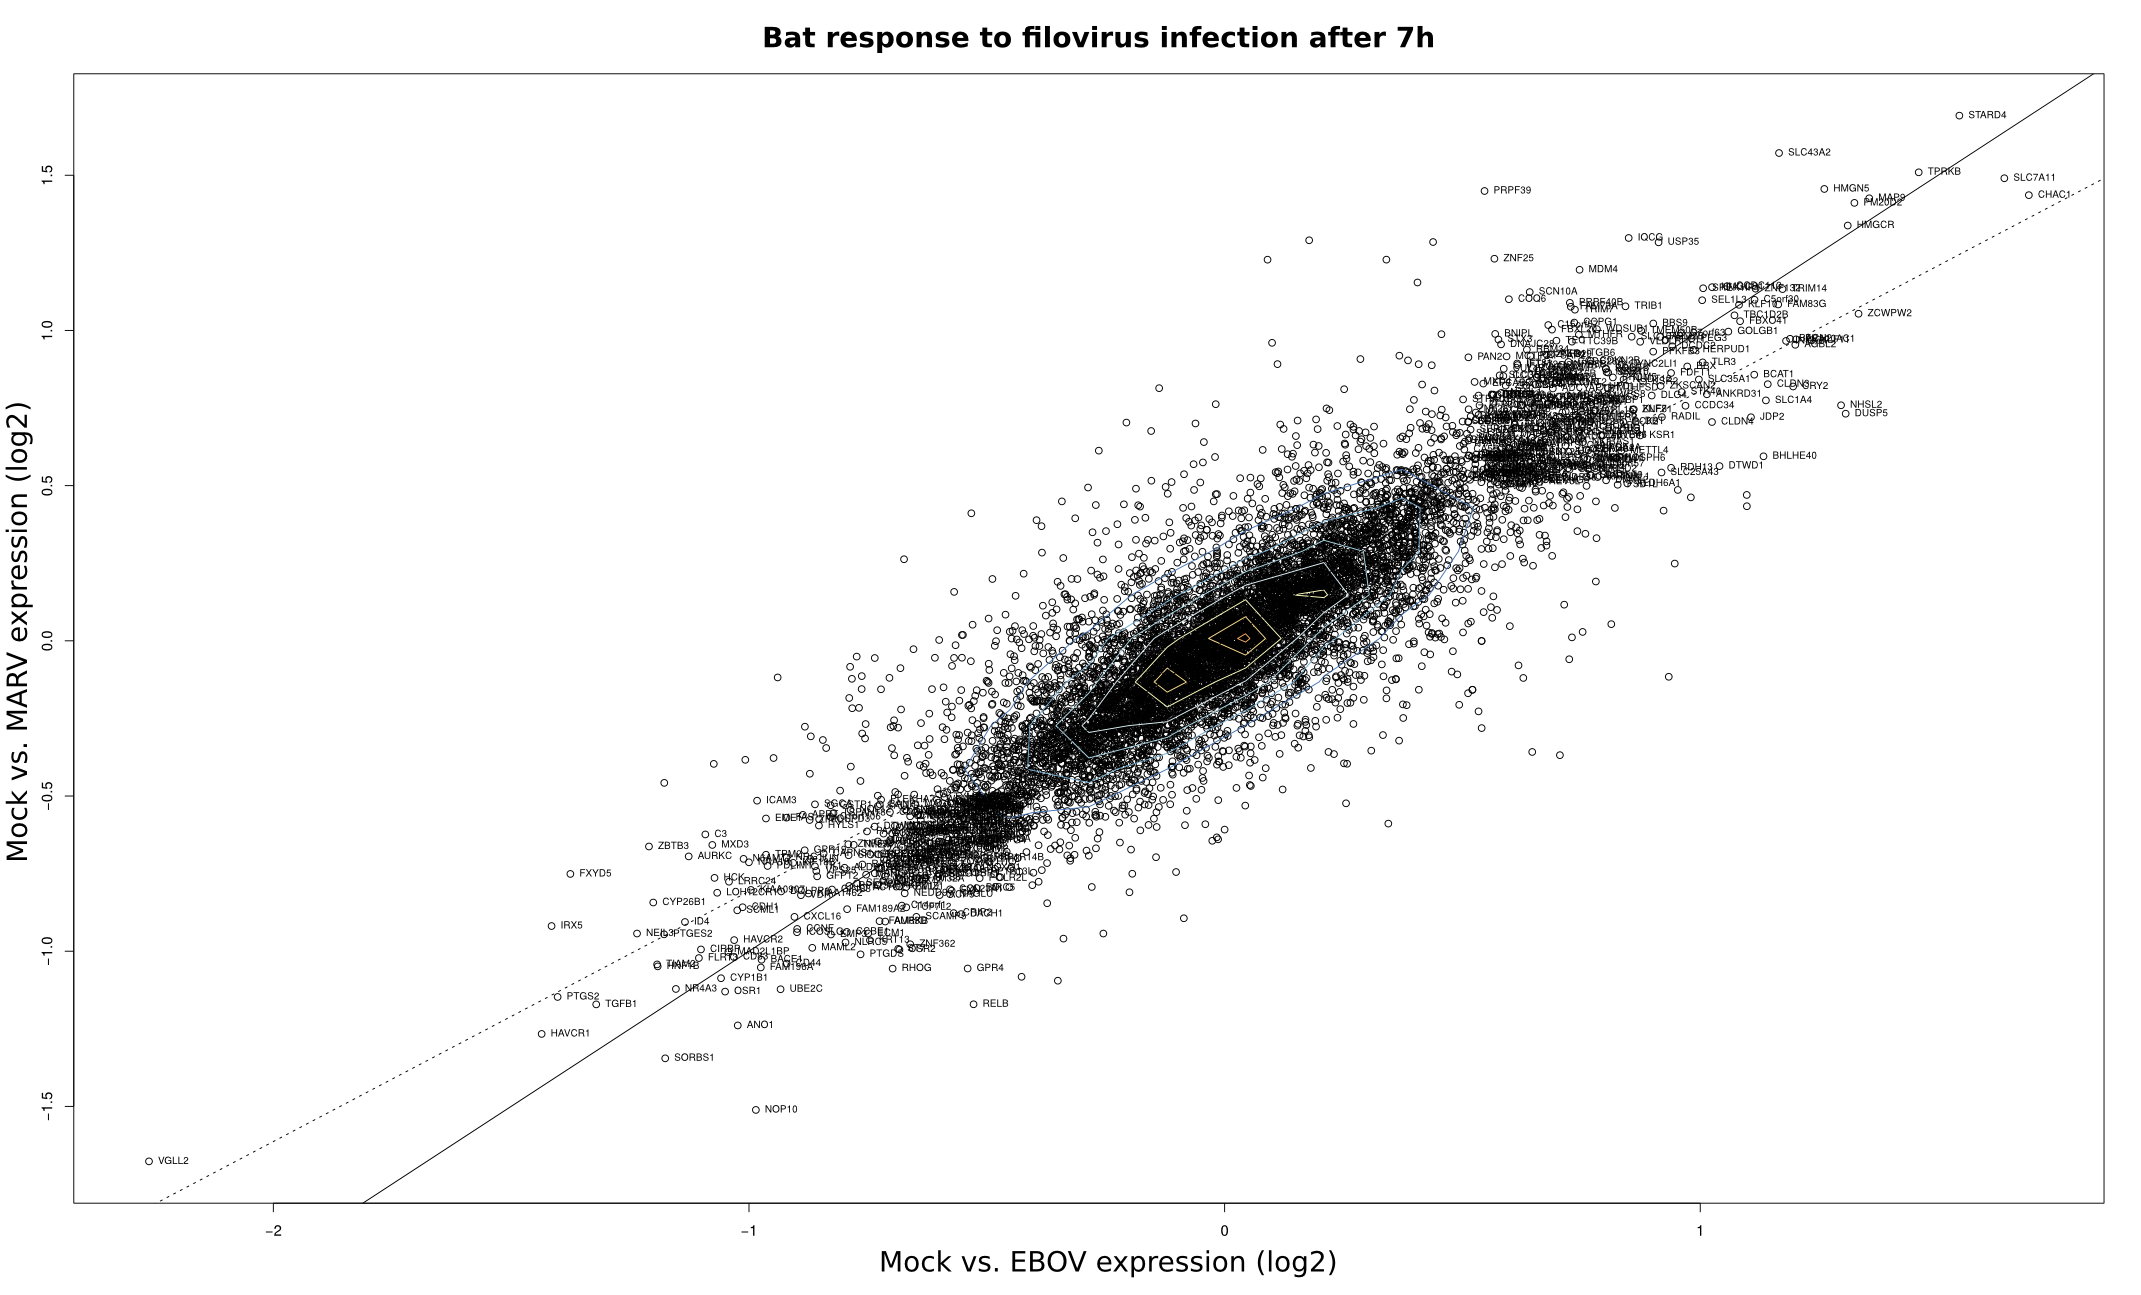
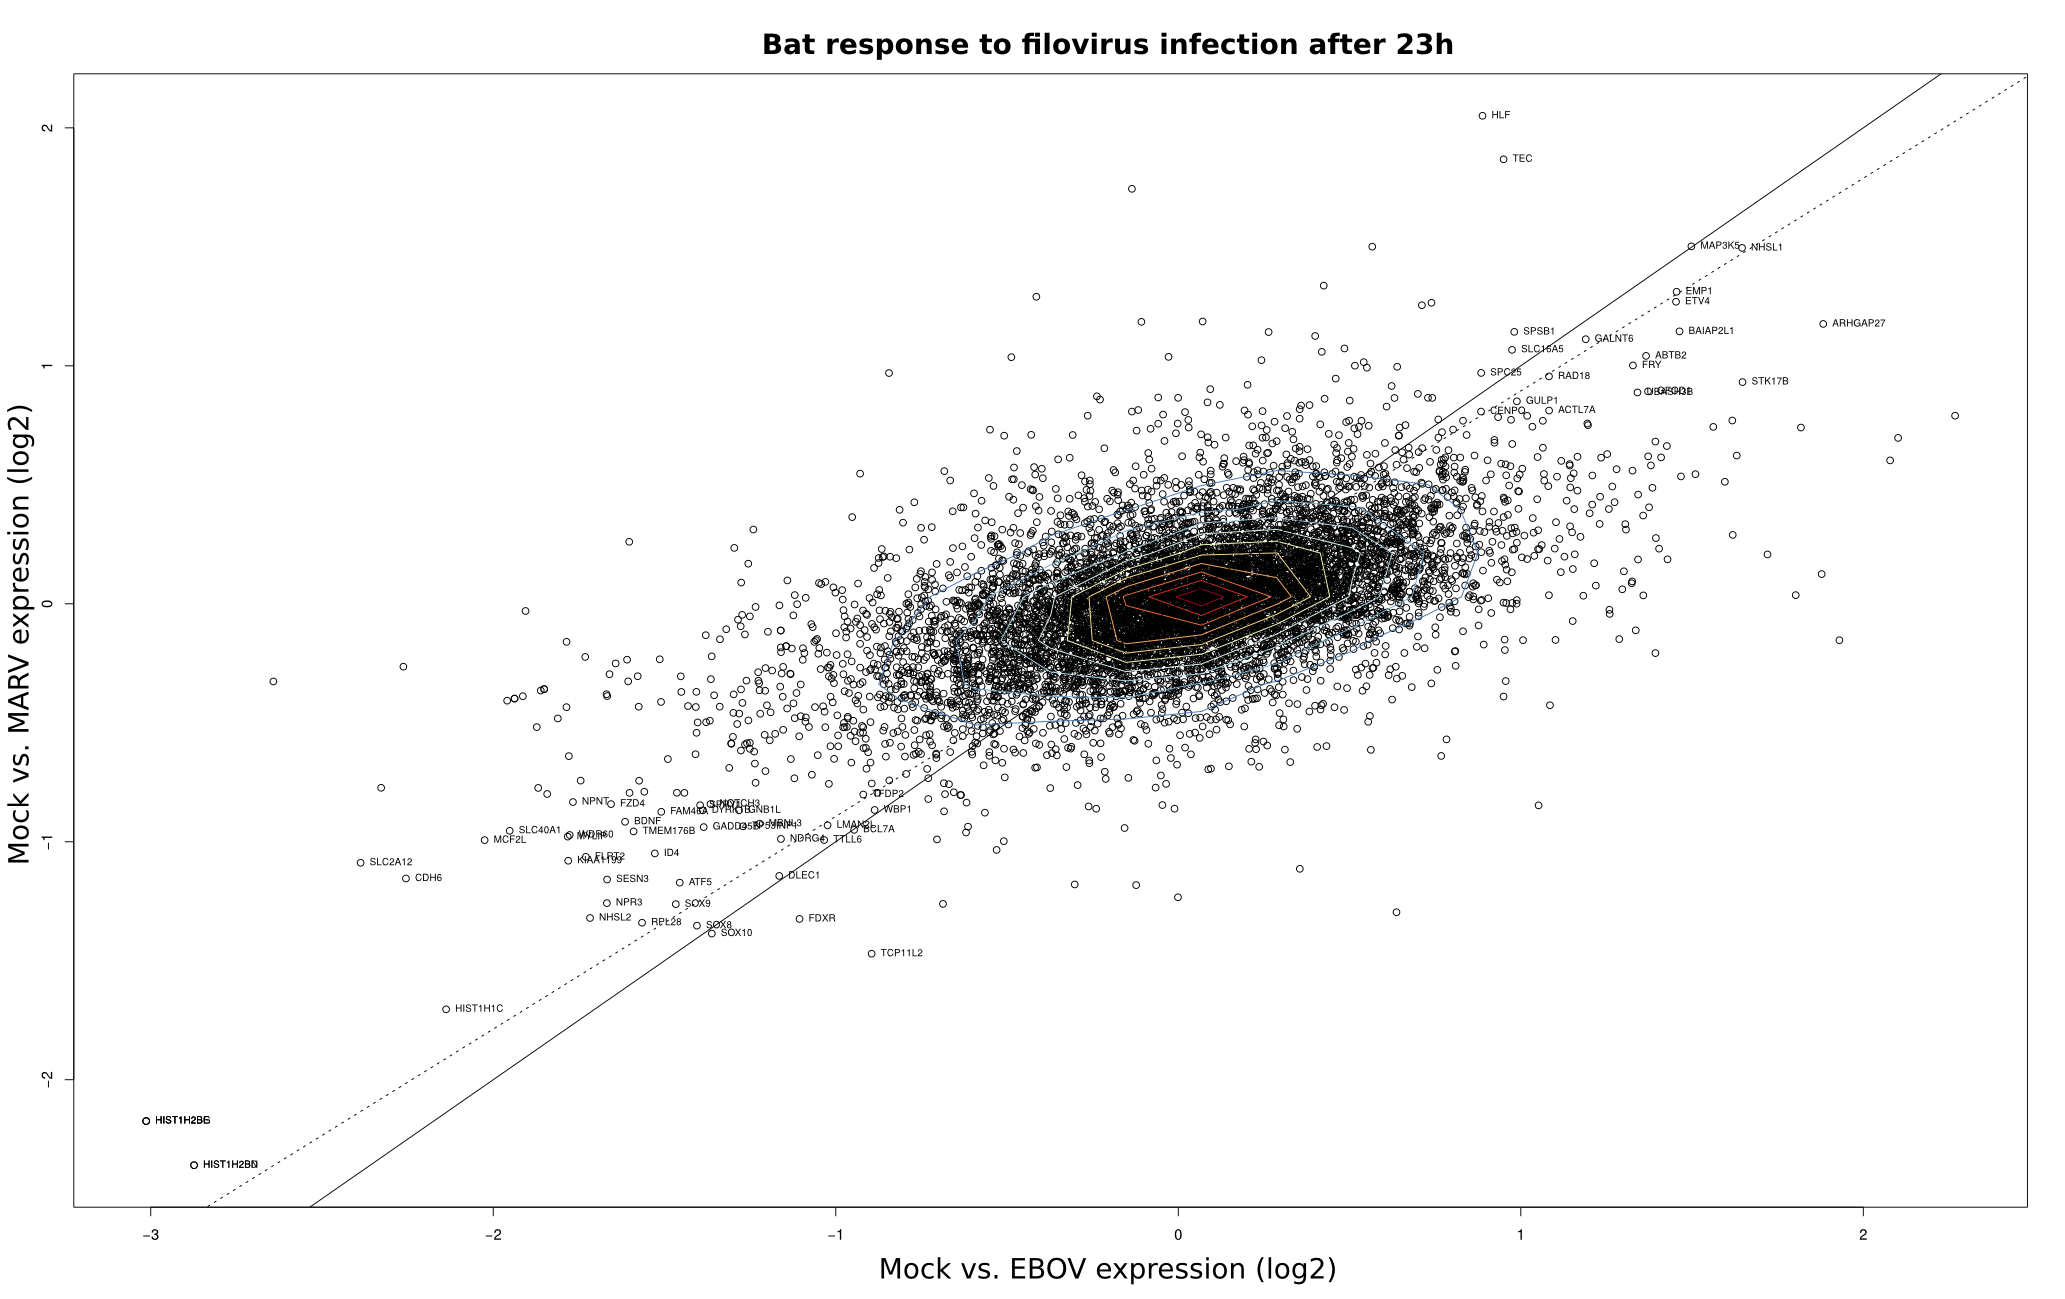
To compare the differential expression of Mock/EBOV and Mock/MARV in human and bat cells, log2 fold changes (FC) as computed by DEseq were visualized using scatter plots in R (x-value: FC of Mock/EBOV; y-value: FC of Mock/MARV). The scatterplots were overlaid with contour plots for a two-dimensional kernel estimate (kde2d; MASS package) using the default parameters. Outliers were labeled with the respective gene names.
| 3h | 7h | 23h | |
Human |
|
|
|
Bat |
|
|
|
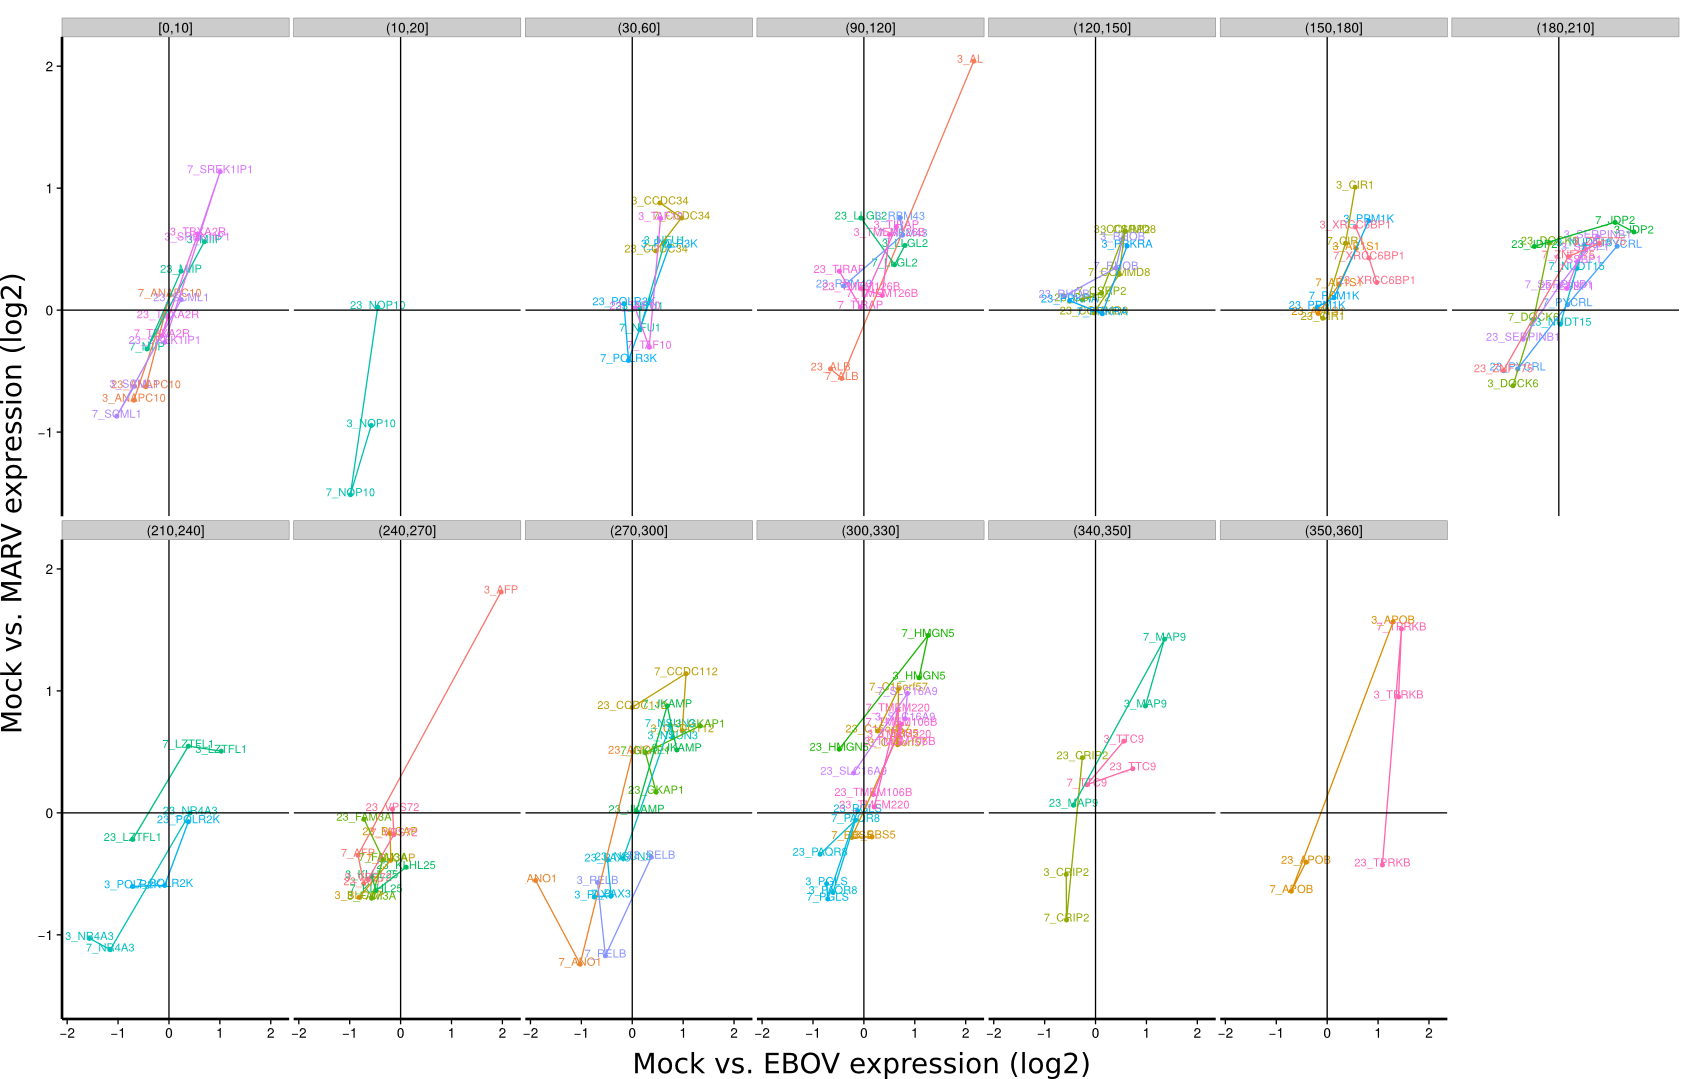
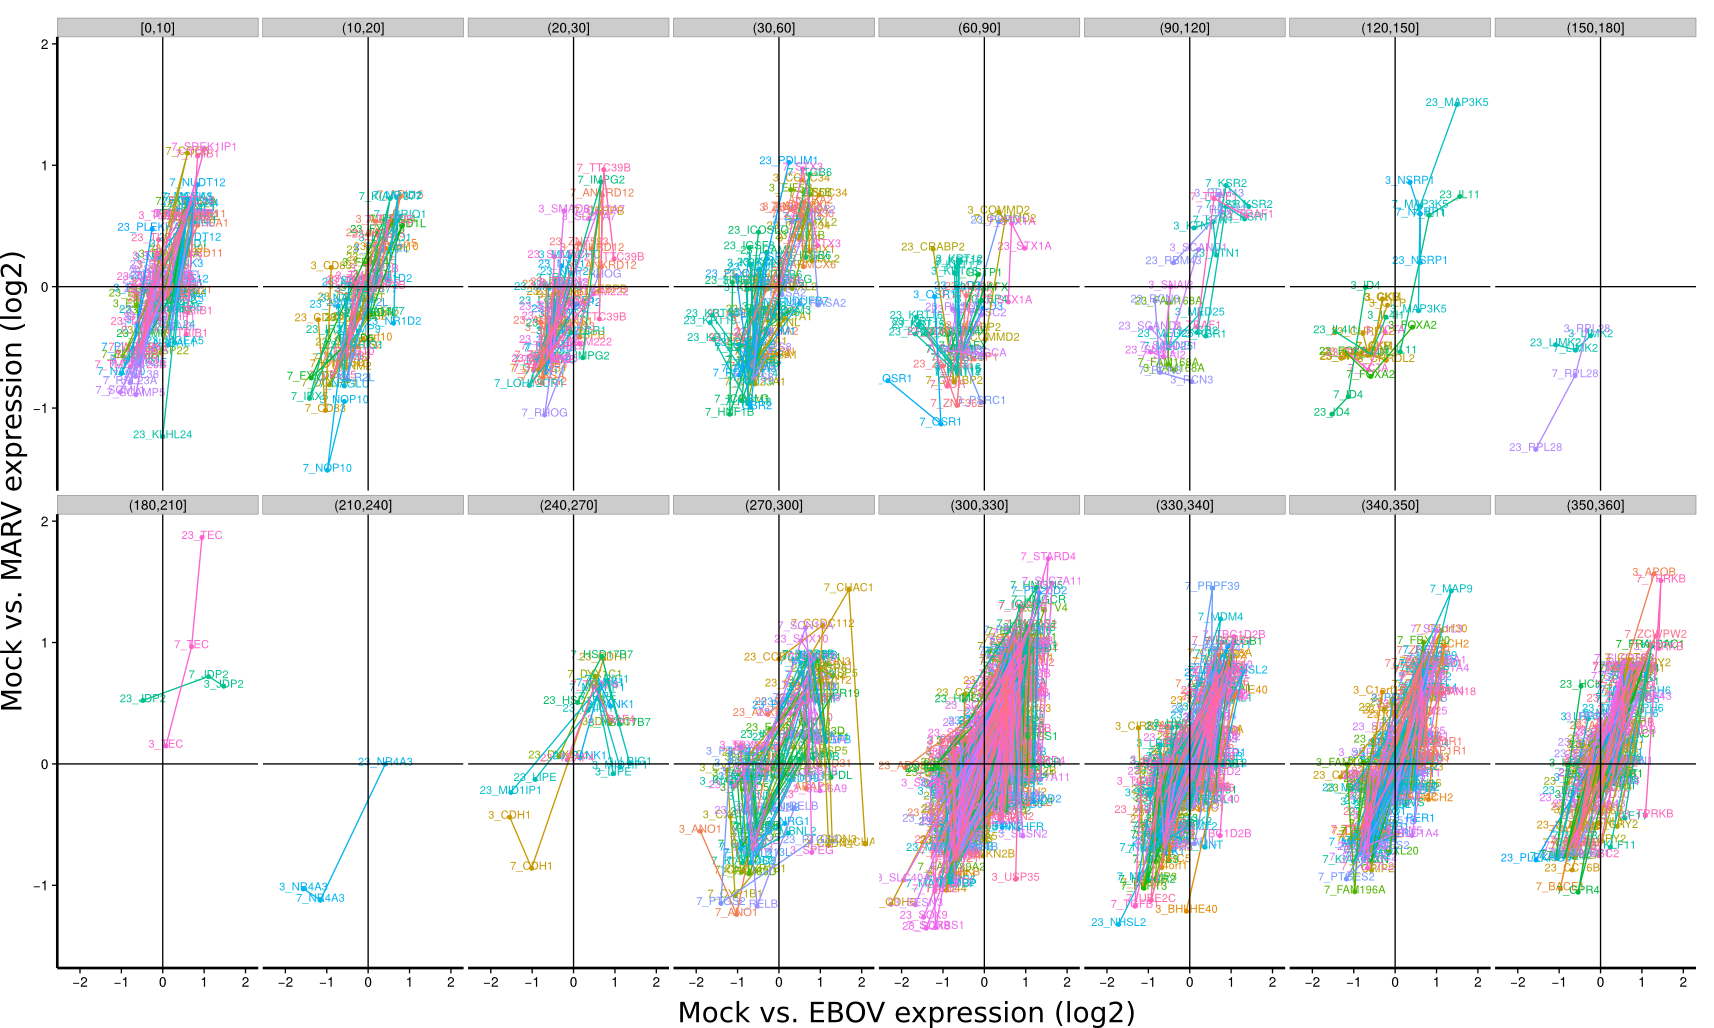
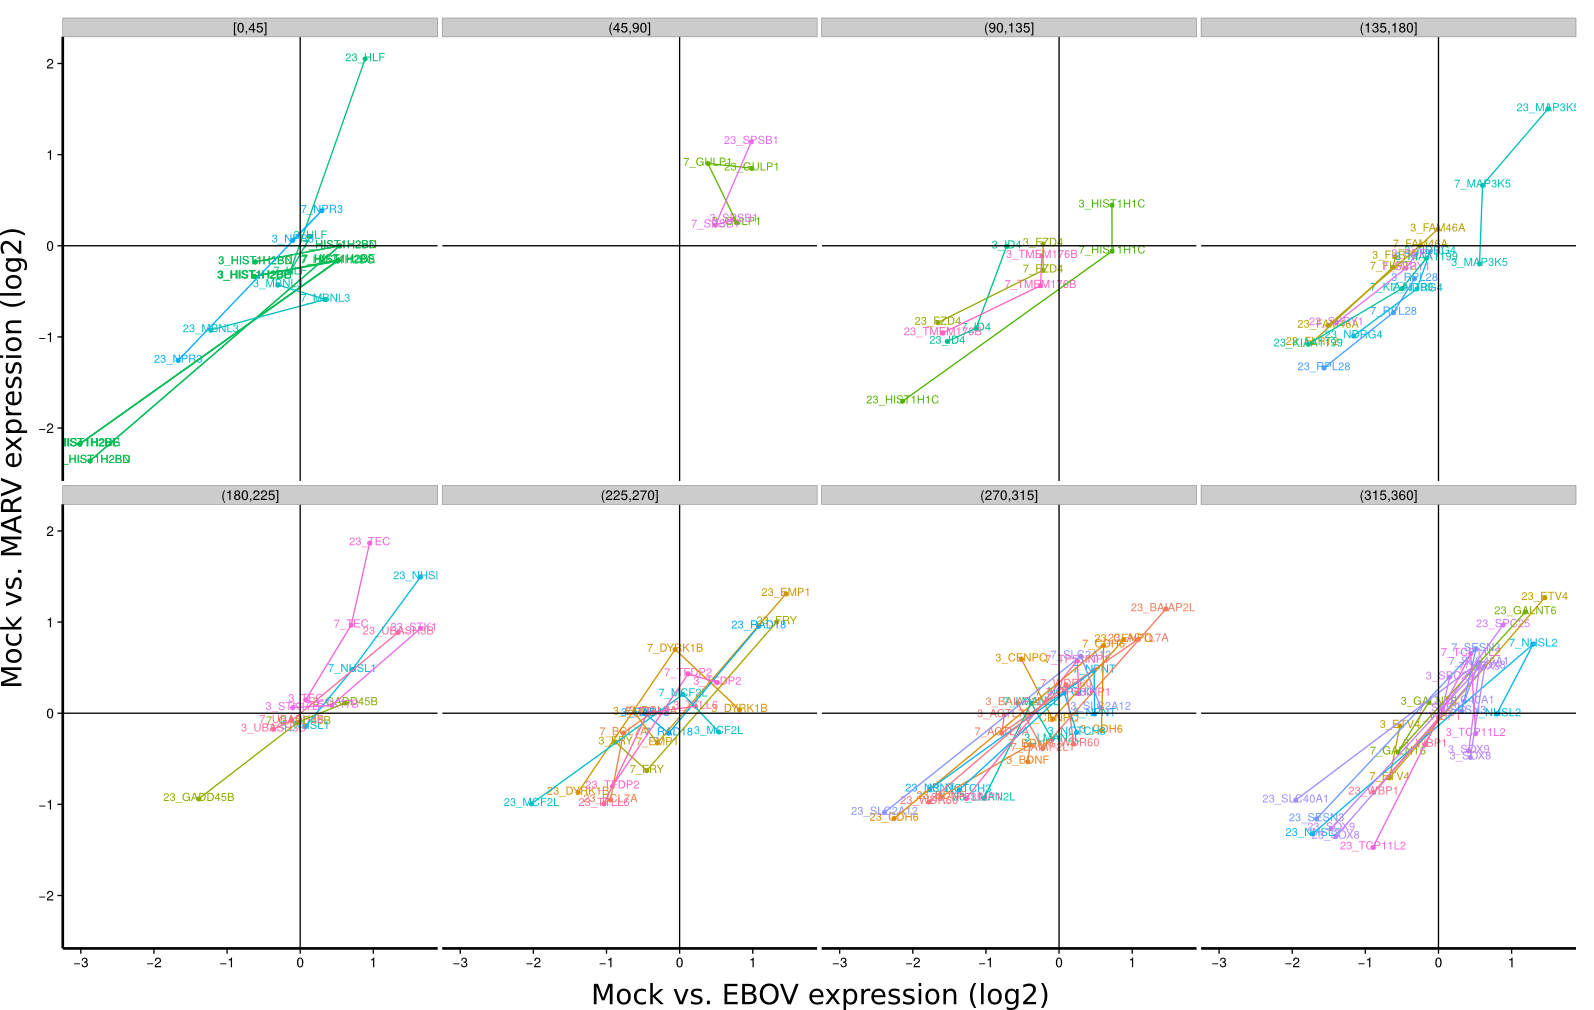
ES 4C: Group plots/Timeseries
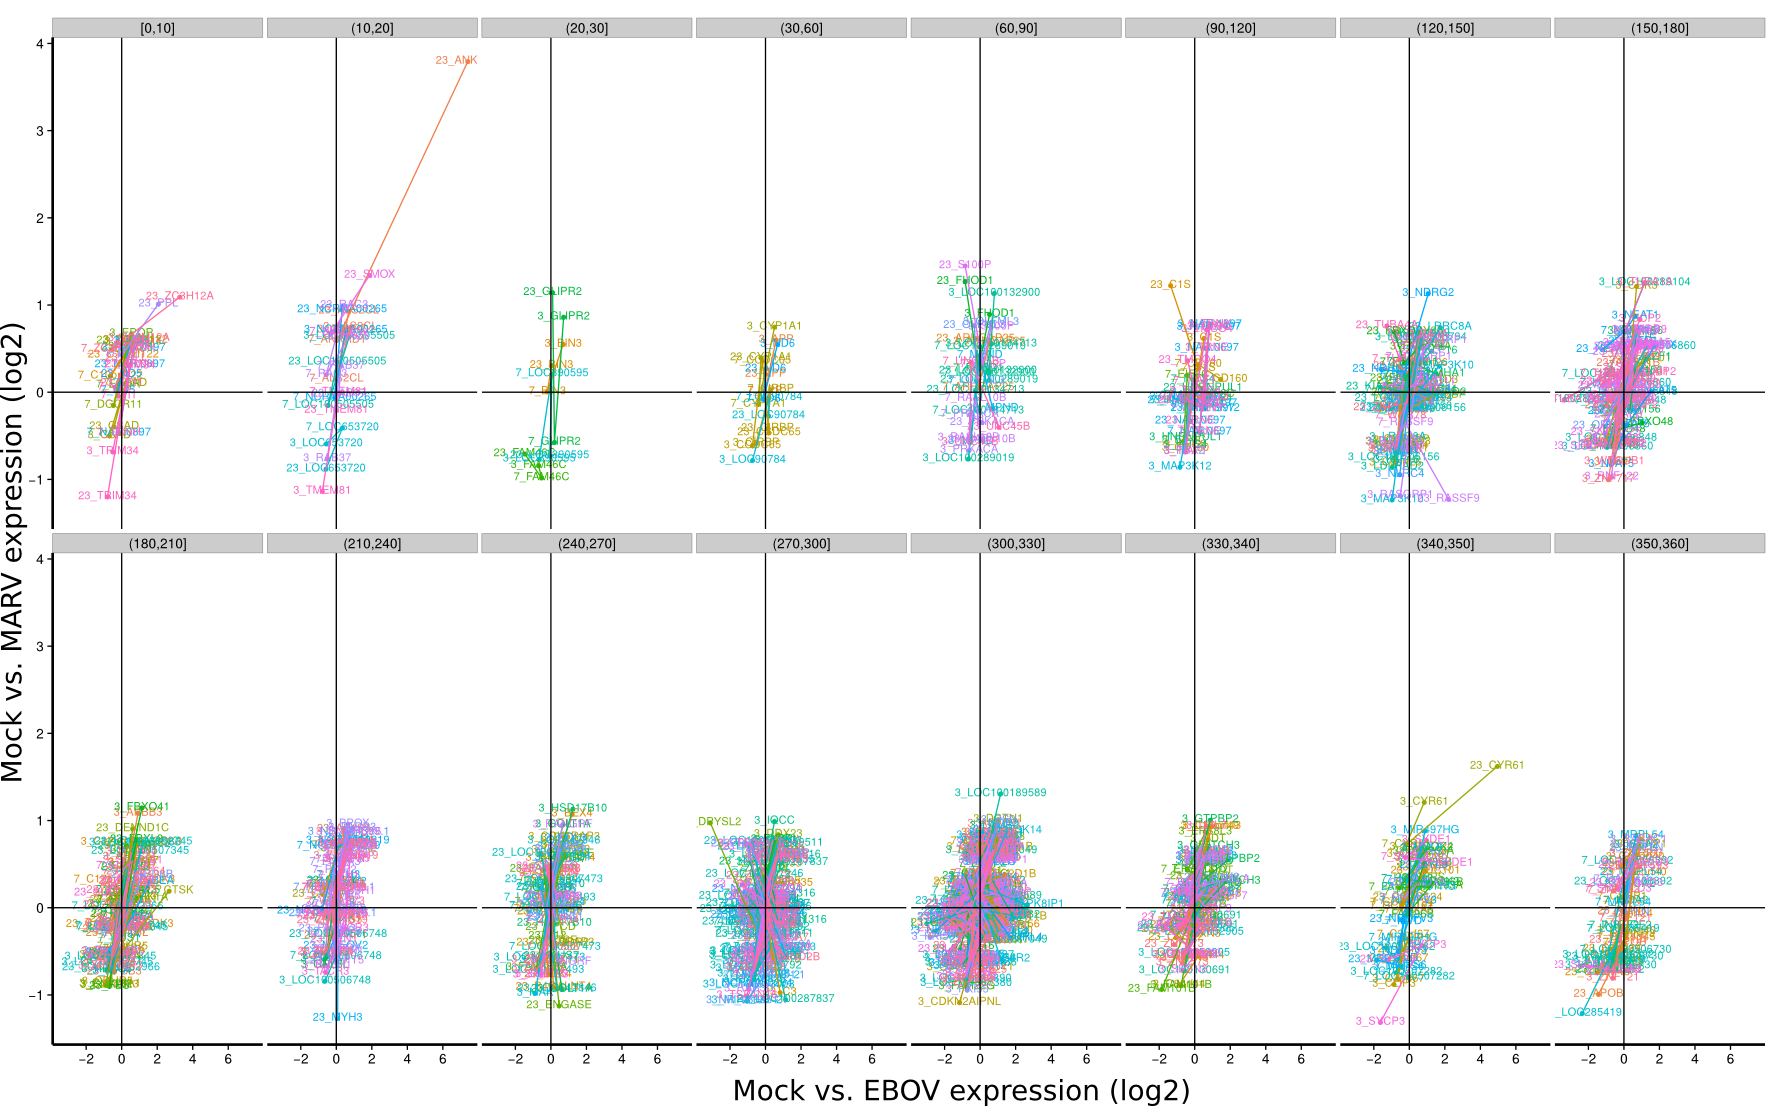
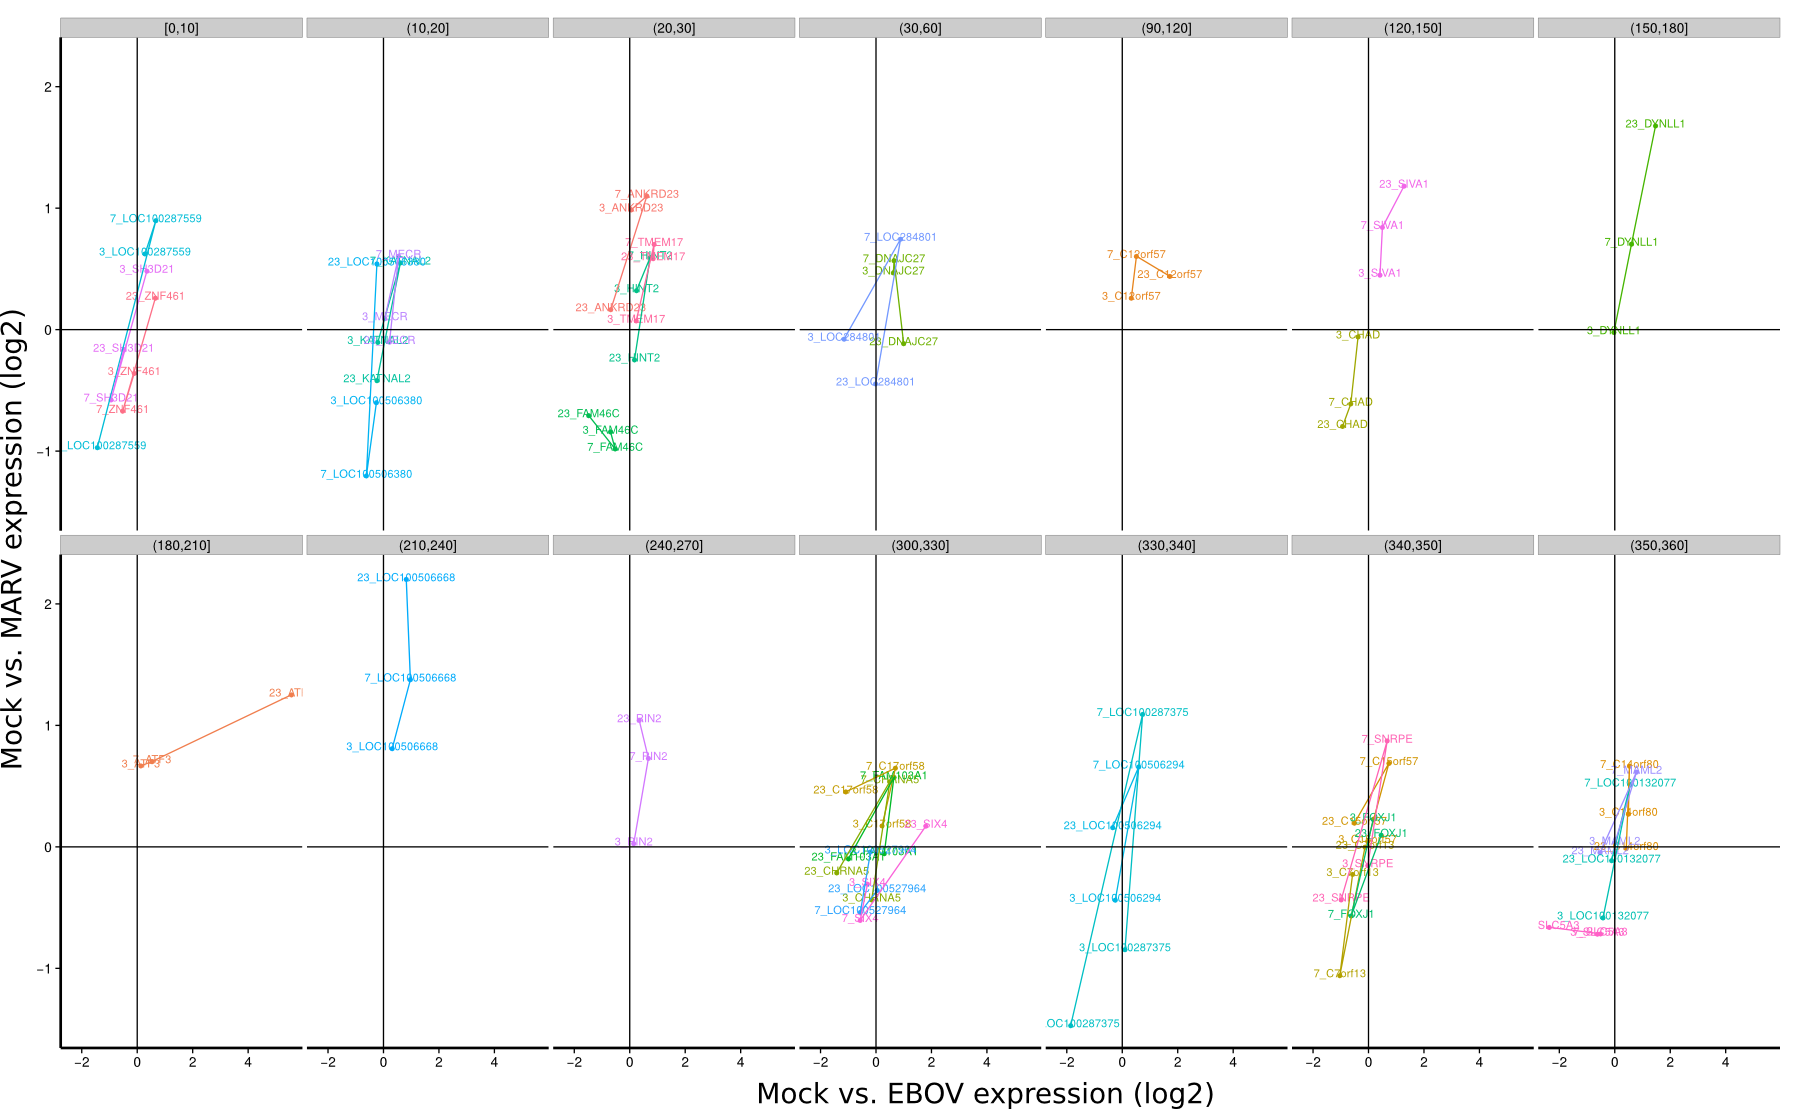
To identify co-regulated genes over the course of the three timepoints (3h, 7h, 23h) the differential expression of Mock/EBOV (x-value) and Mock/MARV (y-value) was visualized for all genes using lines. The expression changes between the three time points define an angle that is subsequently used to group genes that have approximately the same or approximately inverse expression time courses. Note, that the angle between the three time points is rotation invariant.
| 3h | 7h | 23h | |
Human |
|
|
|
Bat |
|
|
|
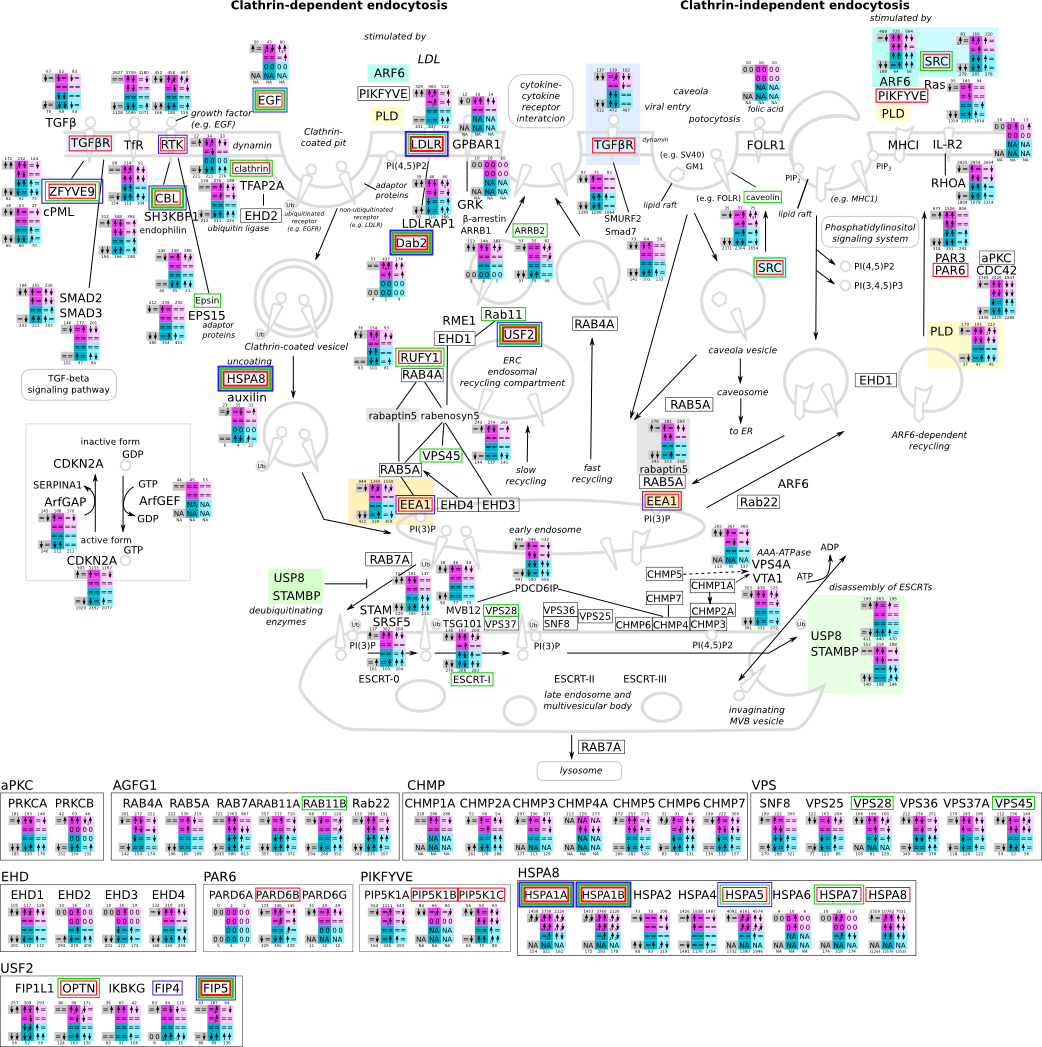
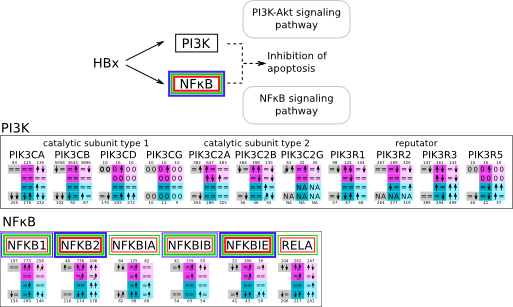
ES 6: Pathways
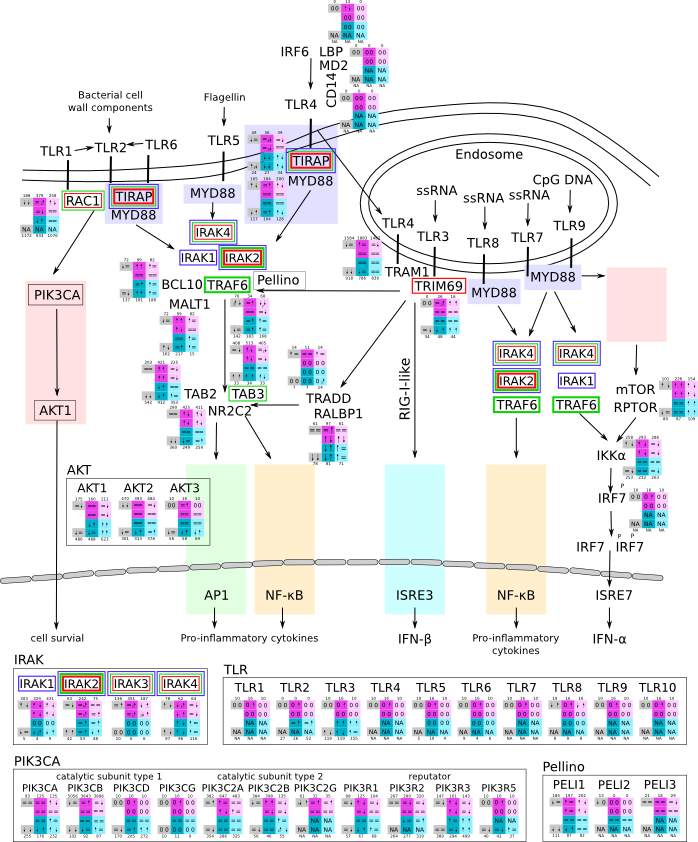
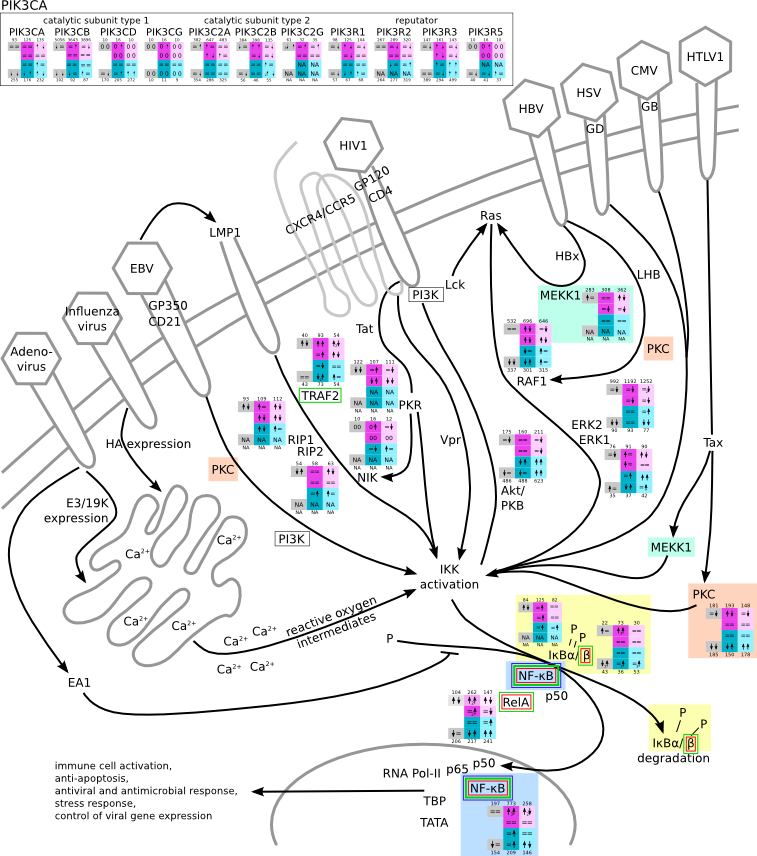
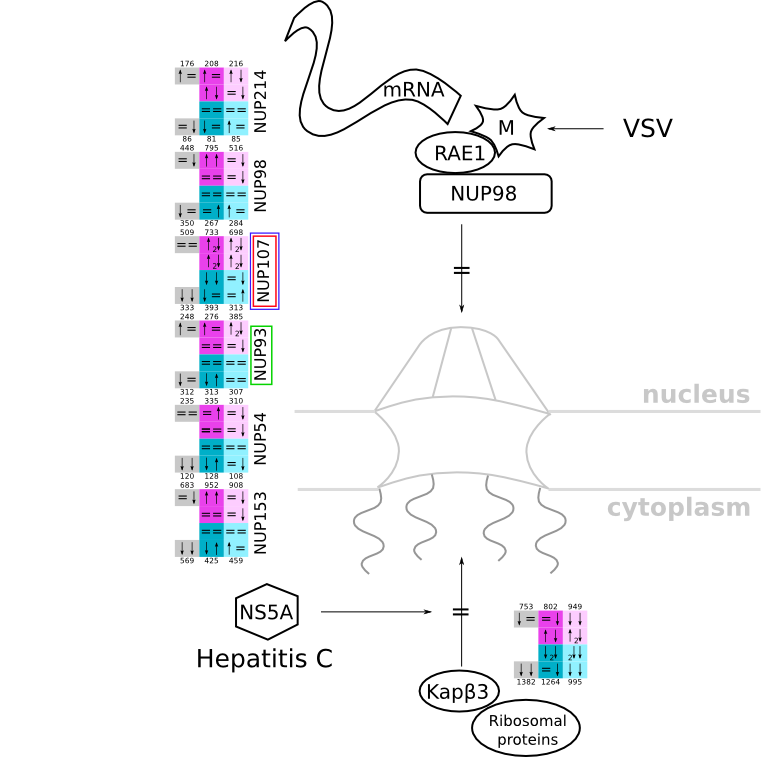
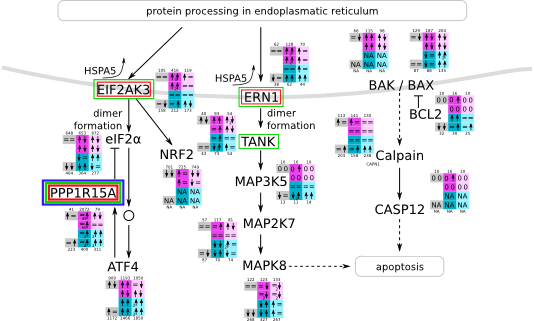
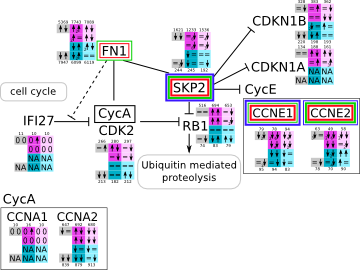
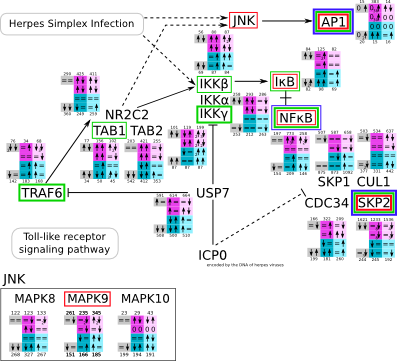
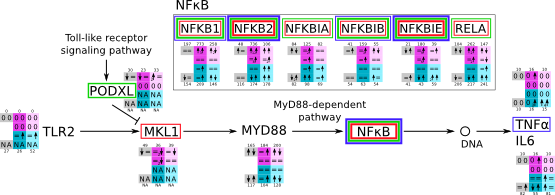
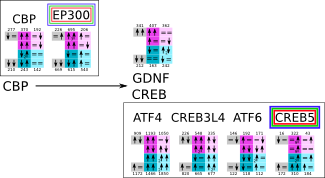
How to read pathway figures
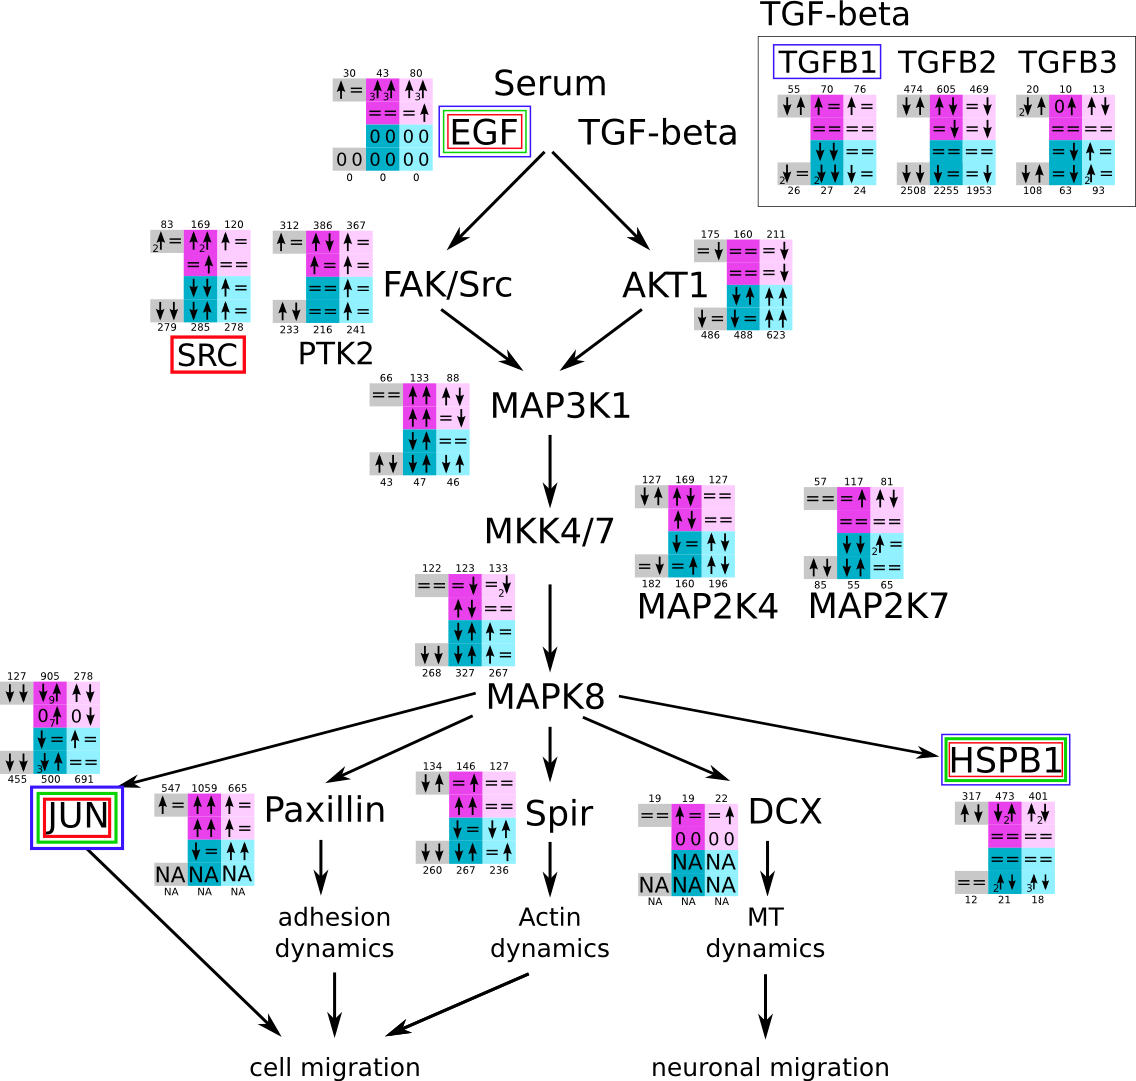
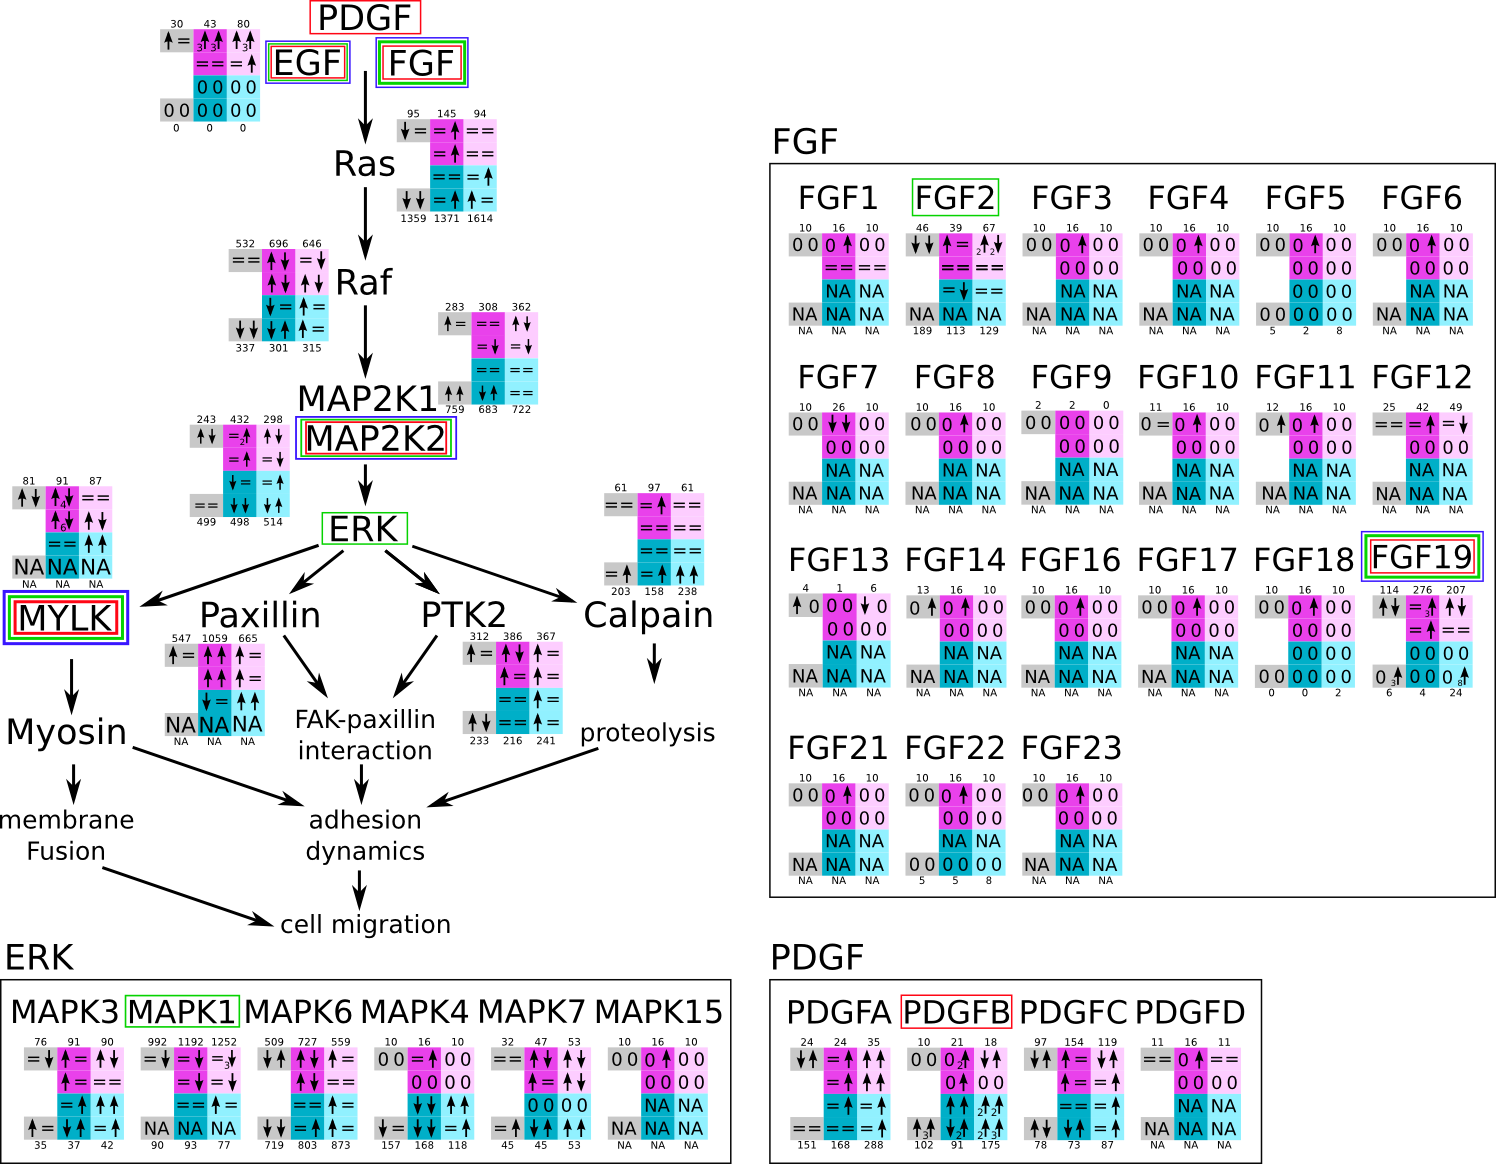
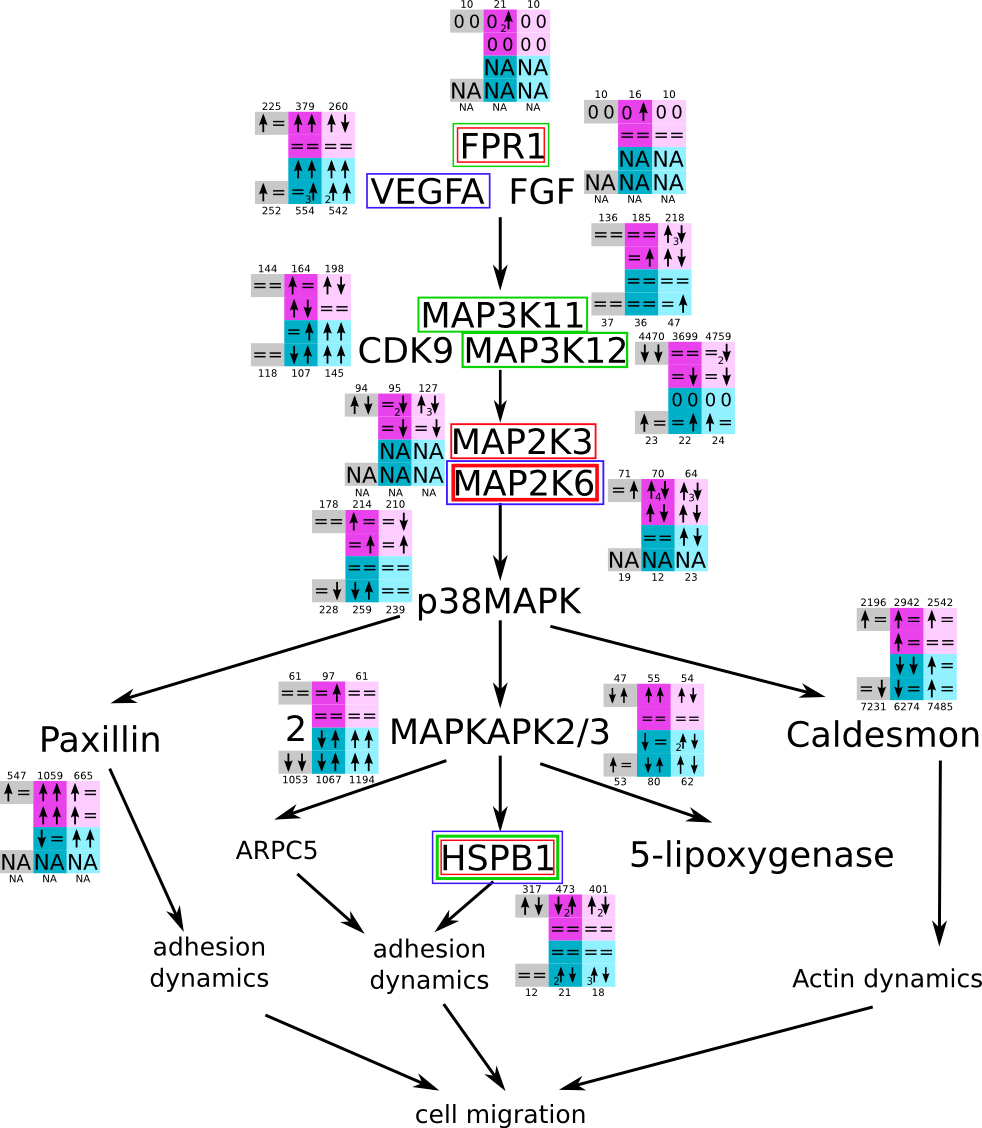
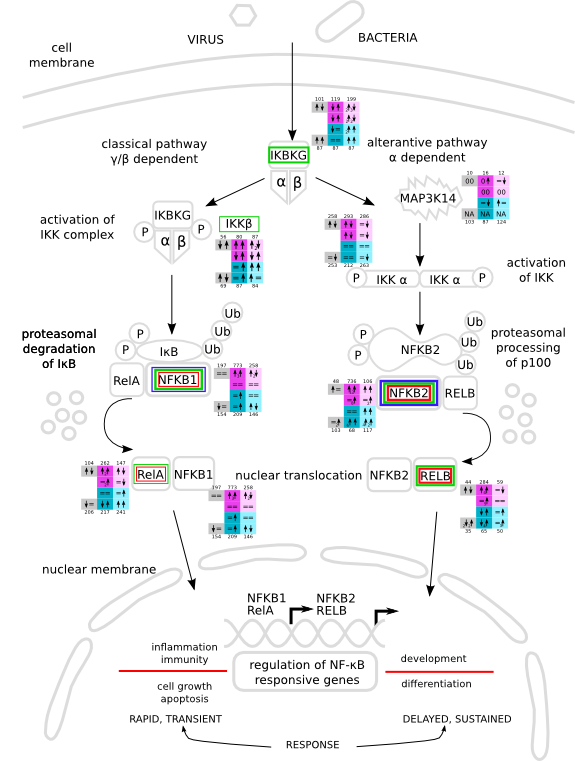
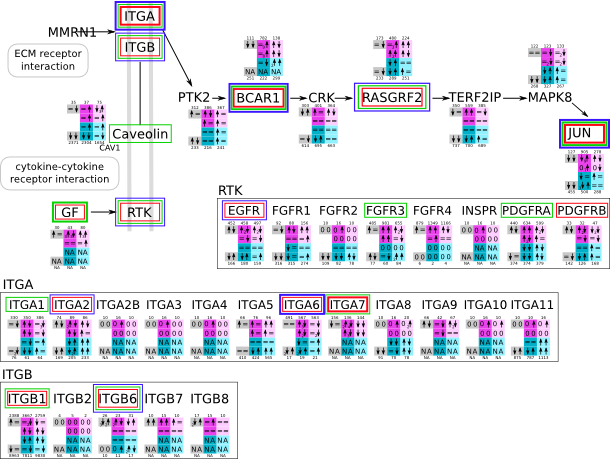
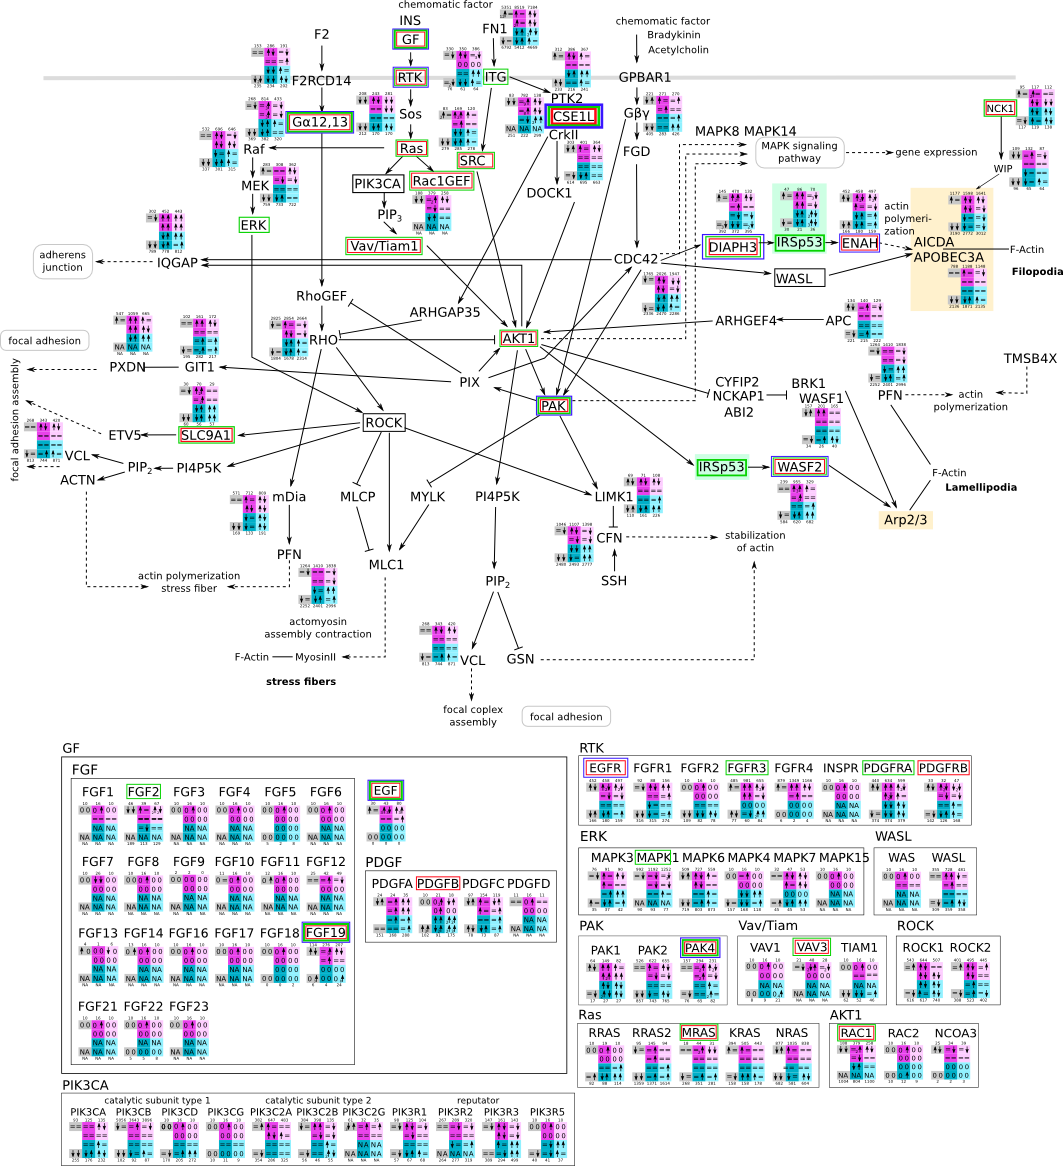
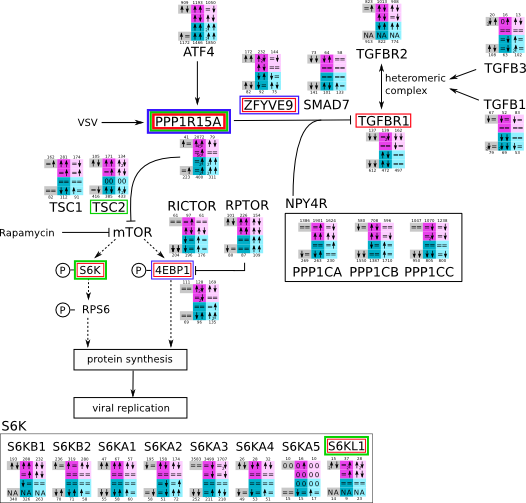
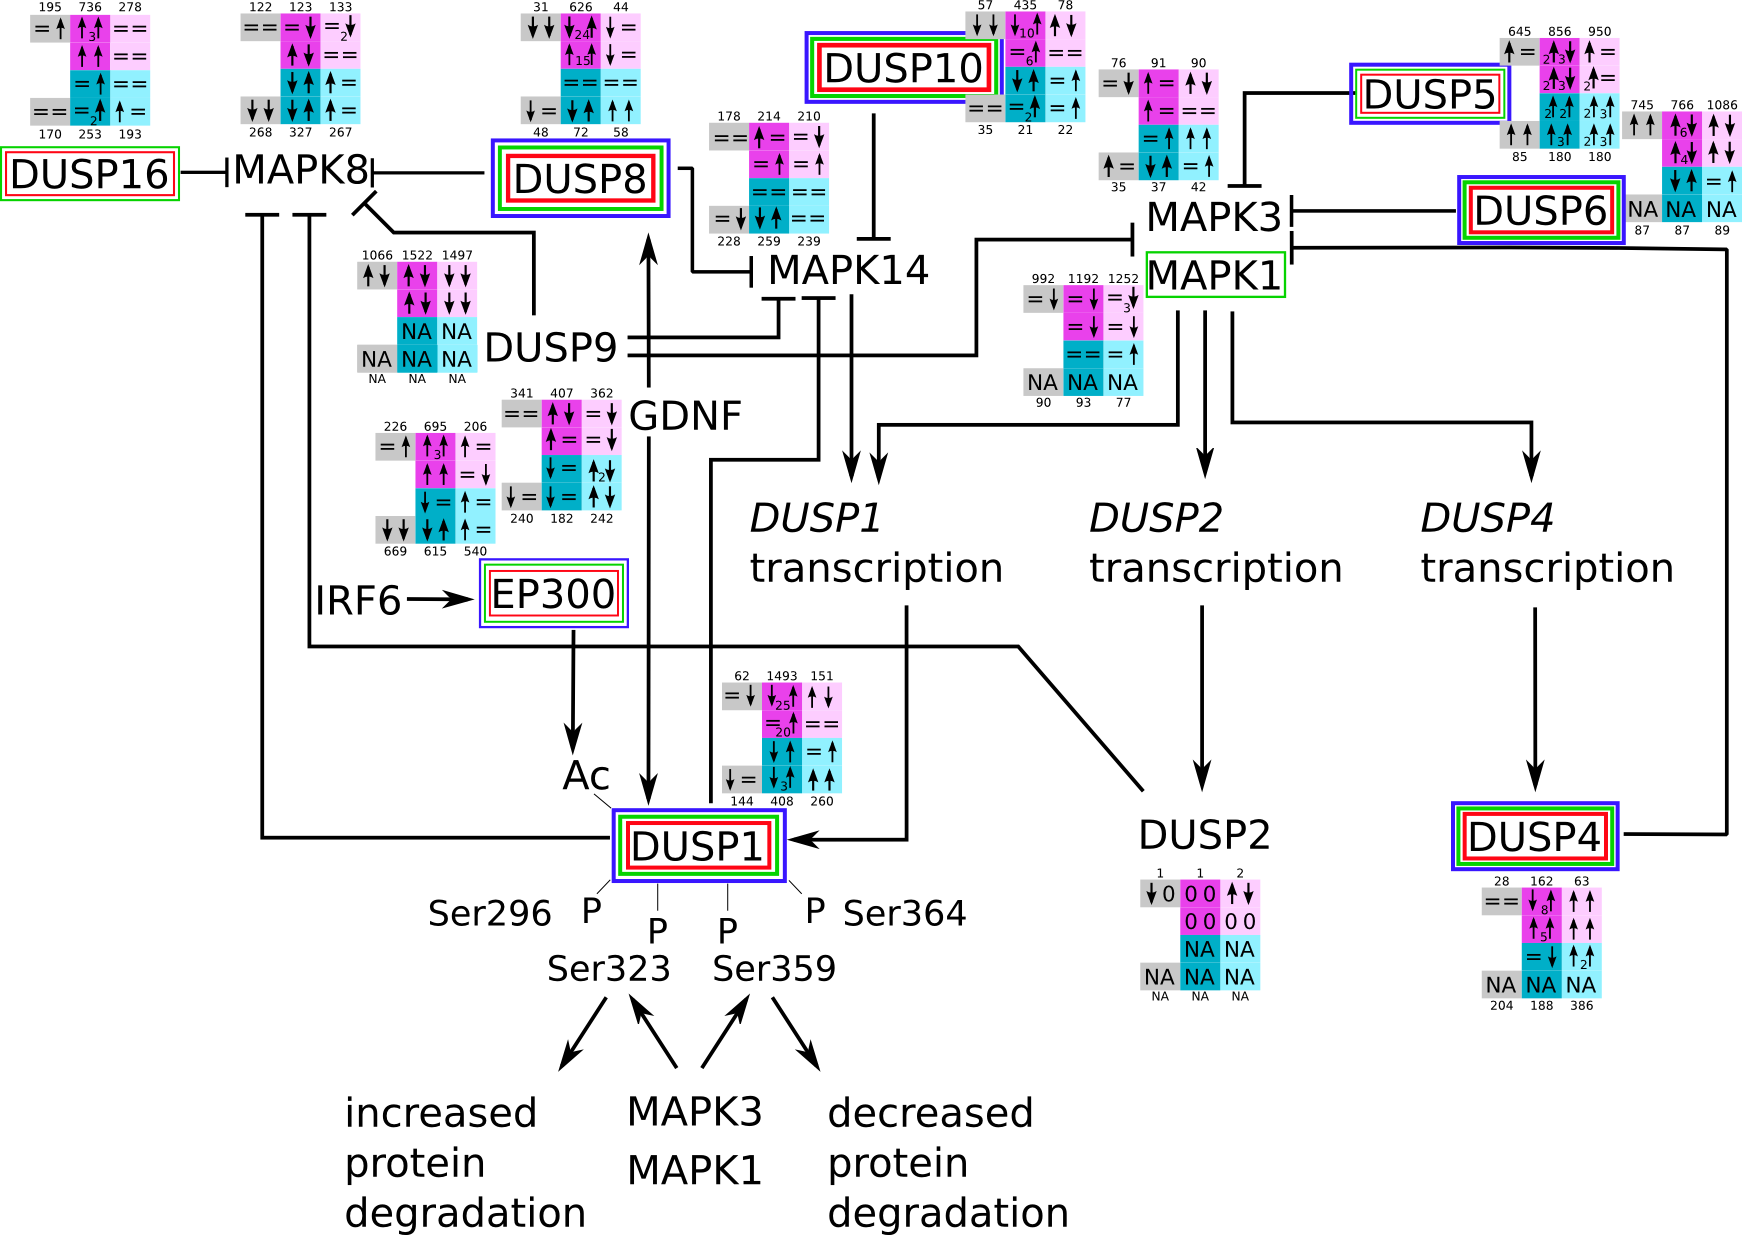
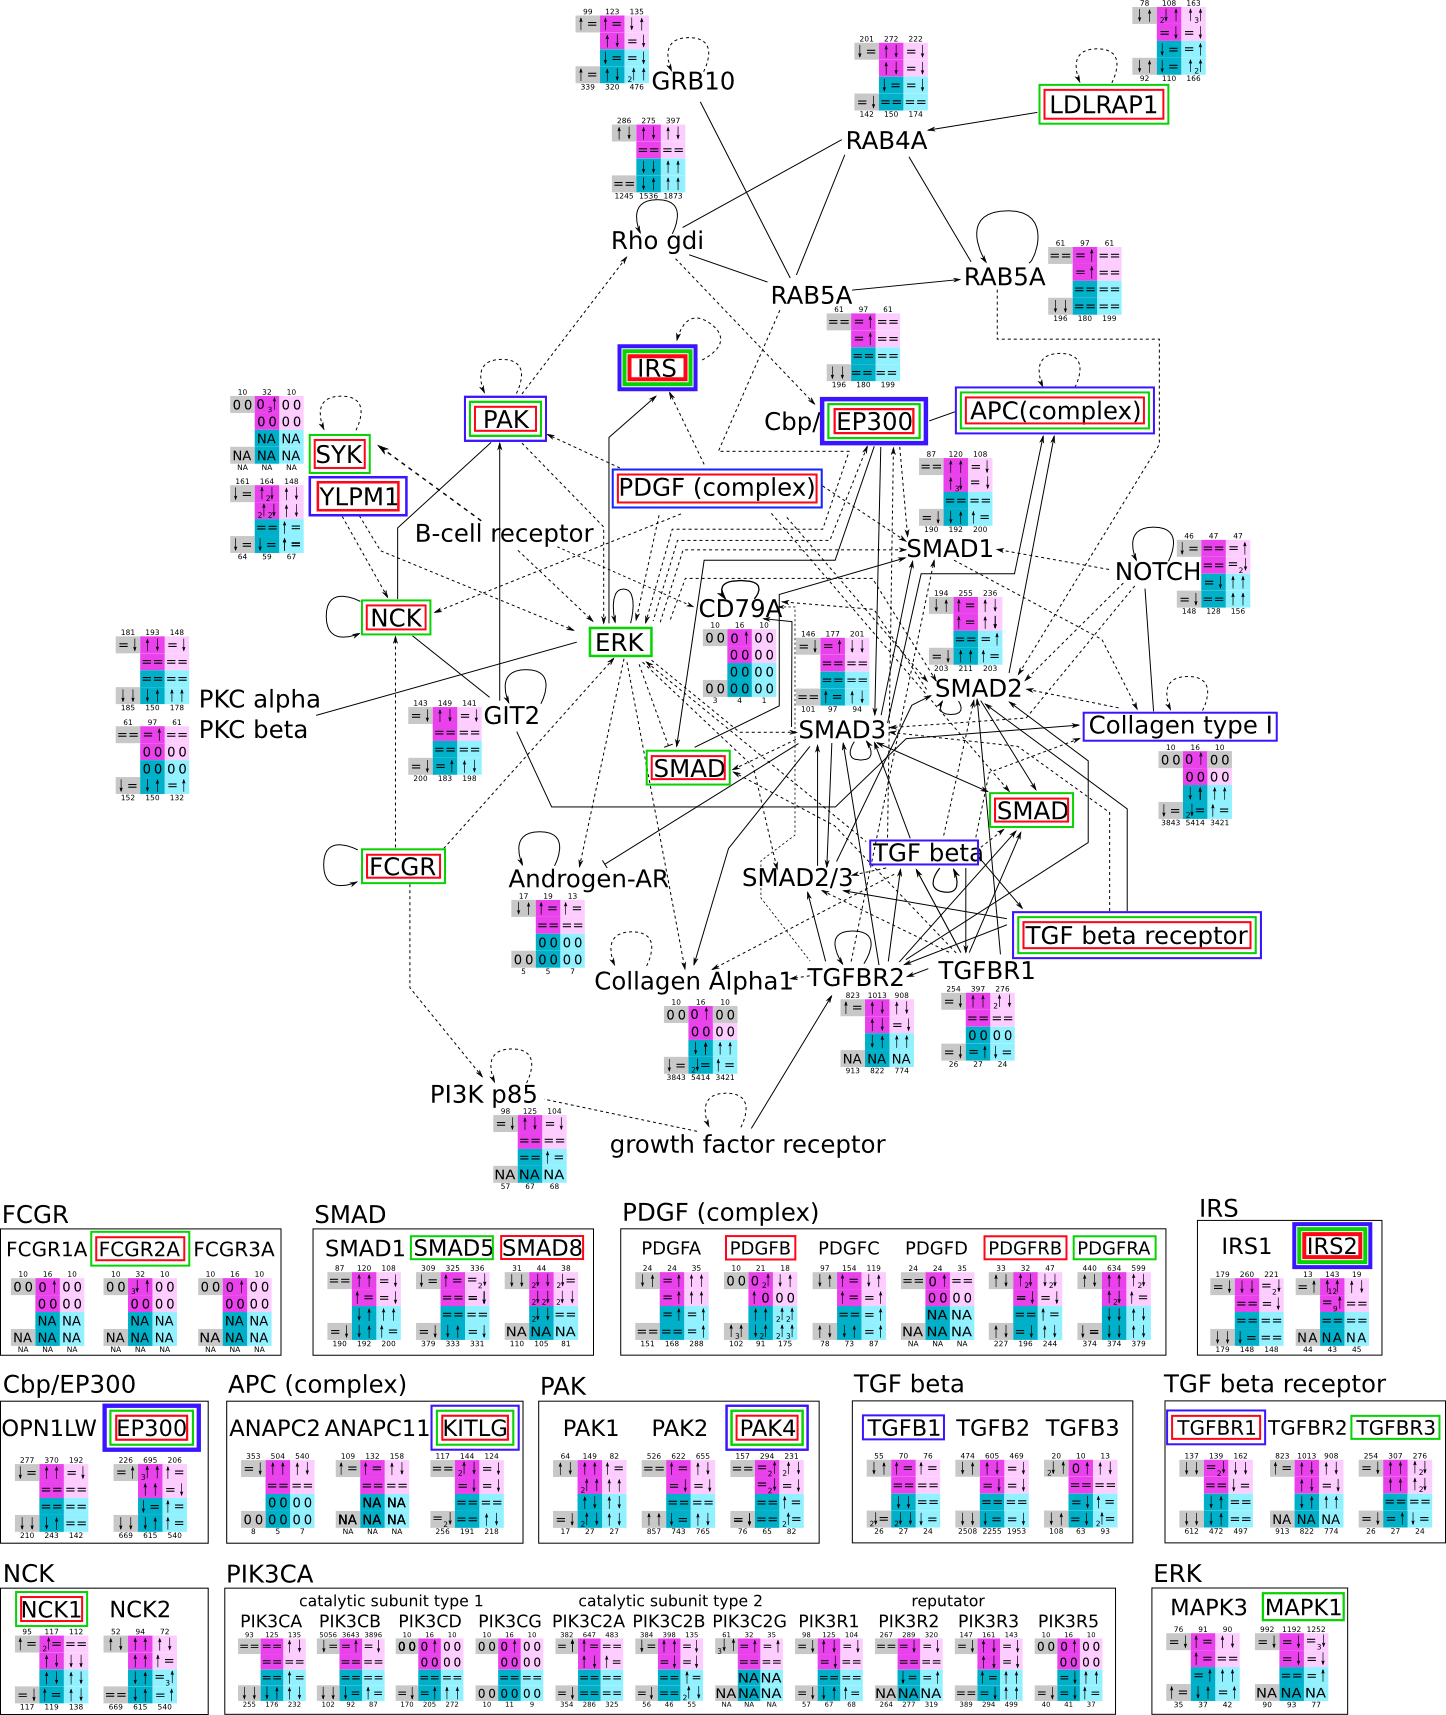
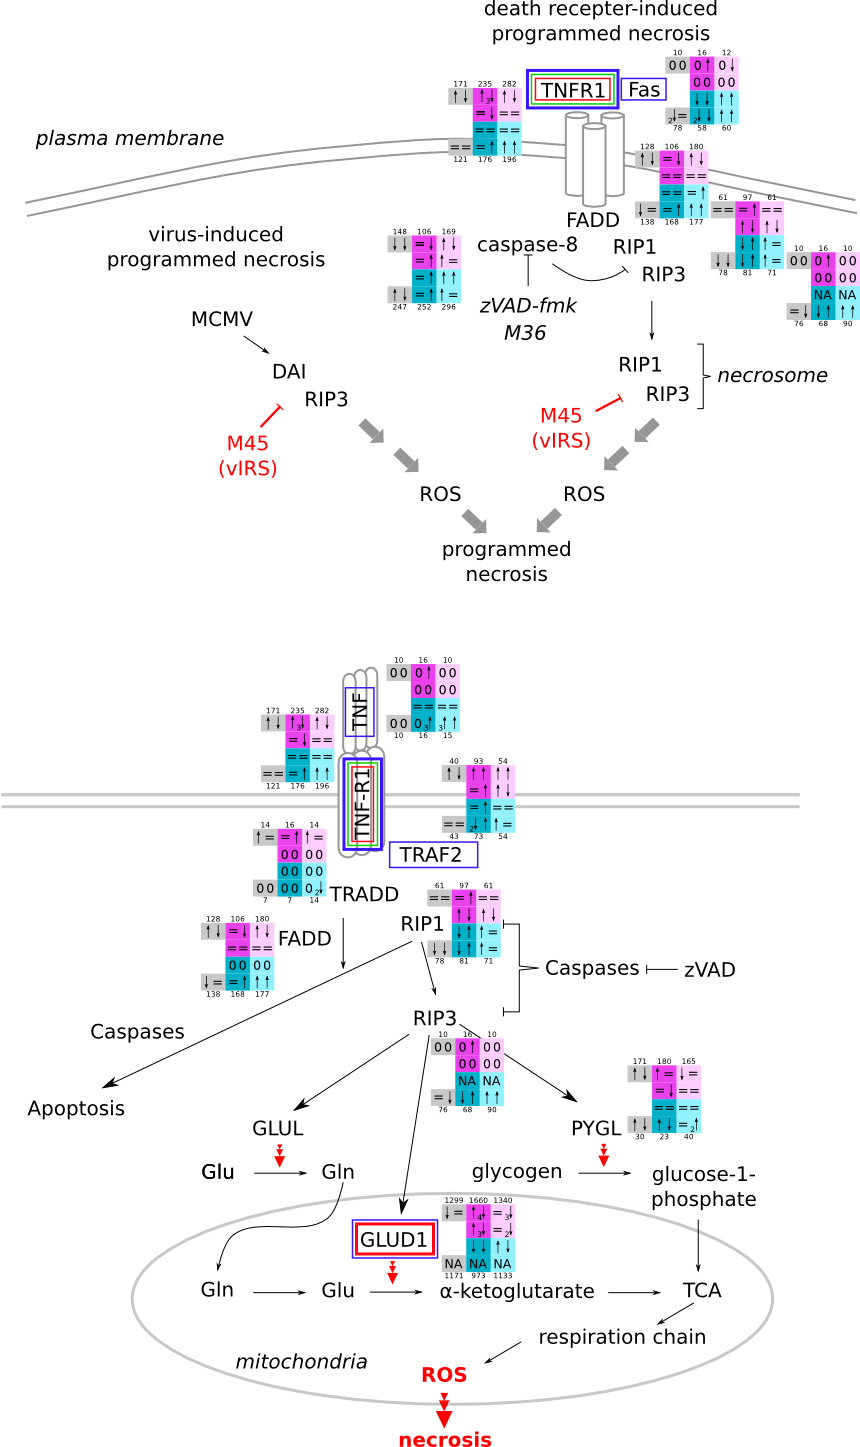
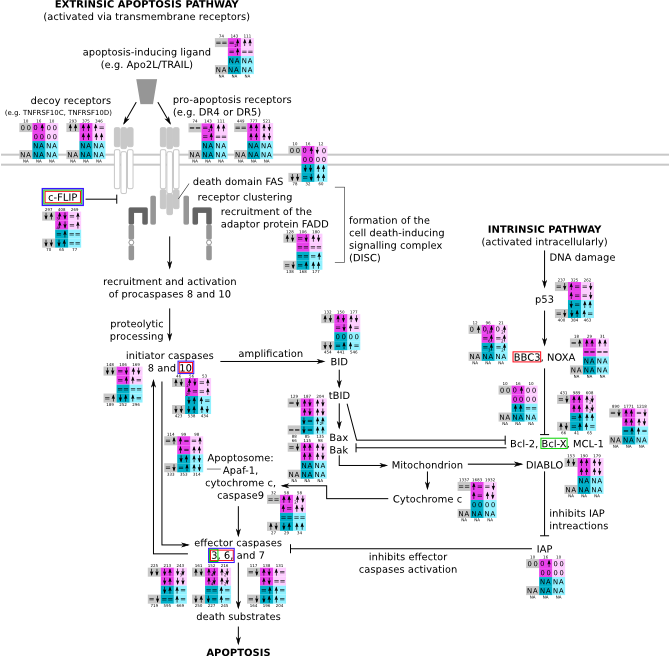
Here, we describe how to read the gene-regulation boxes next to each gene, to fastly follow the pathways and their regulations over all time points, infections and hosts. Shown are the most significant genes according to expression level differences. To give an example how to read the boxes displayed here and in the different pathways in the electronical supplement, we use DUSP8 for explanation:
The upper half (pink) displays human samples, the lower half (blue) refers to bat samples. DUSP8 is in human Mock cells is slightly down-regulated from 3 to 7h, furthermore slightly down-regulated from 7 to 23h. The minimum of transcripts for all three timepoints in human Mock cells is read_max=31. In EBOV-infected human cells we observe from 3-7h a slight down-regulation, although the manual profile impression leads a slight up-regulation. From 7 to 23h we see a dramatic up-regulation of 25X leading to a read_max of 626. For MARV-infected human cells we see from 3-7h a slight down-regulation similar to EBOV-infected human cells from 3-7h, however this mRNA level stays from 7 to 23h constant. In bats we observe in Mock from 7 to 23h a slight down-regulation, similar to EBOV-infected bat cells from 3h to 7h. In a later stage, we observe a slight up-regulation, just as during the complete MARV-infected bat cells. The regulation level is only changing slightly as depicted in the manual search.
Furthermore, we framed each gene red, when being differentially expressed in human between the different time points. We added a green frame, when a difference between EBOV and MARV was observed in the general expression and we used blue to mark differences between human and bat transcriptome levels. The line width of the frame corresponds to the significance of the expressional change.
NA - not assigned; no bat homologous gene was detected. When the expression level changes by >15% an arrow indicates the regulation; when the expression level changes by more than 100% (2-fold transcription) a number beside the arrow indicates the fold change.

Investigated Pathways
| Overview of all kingpins and related interactions svg pdf and description |
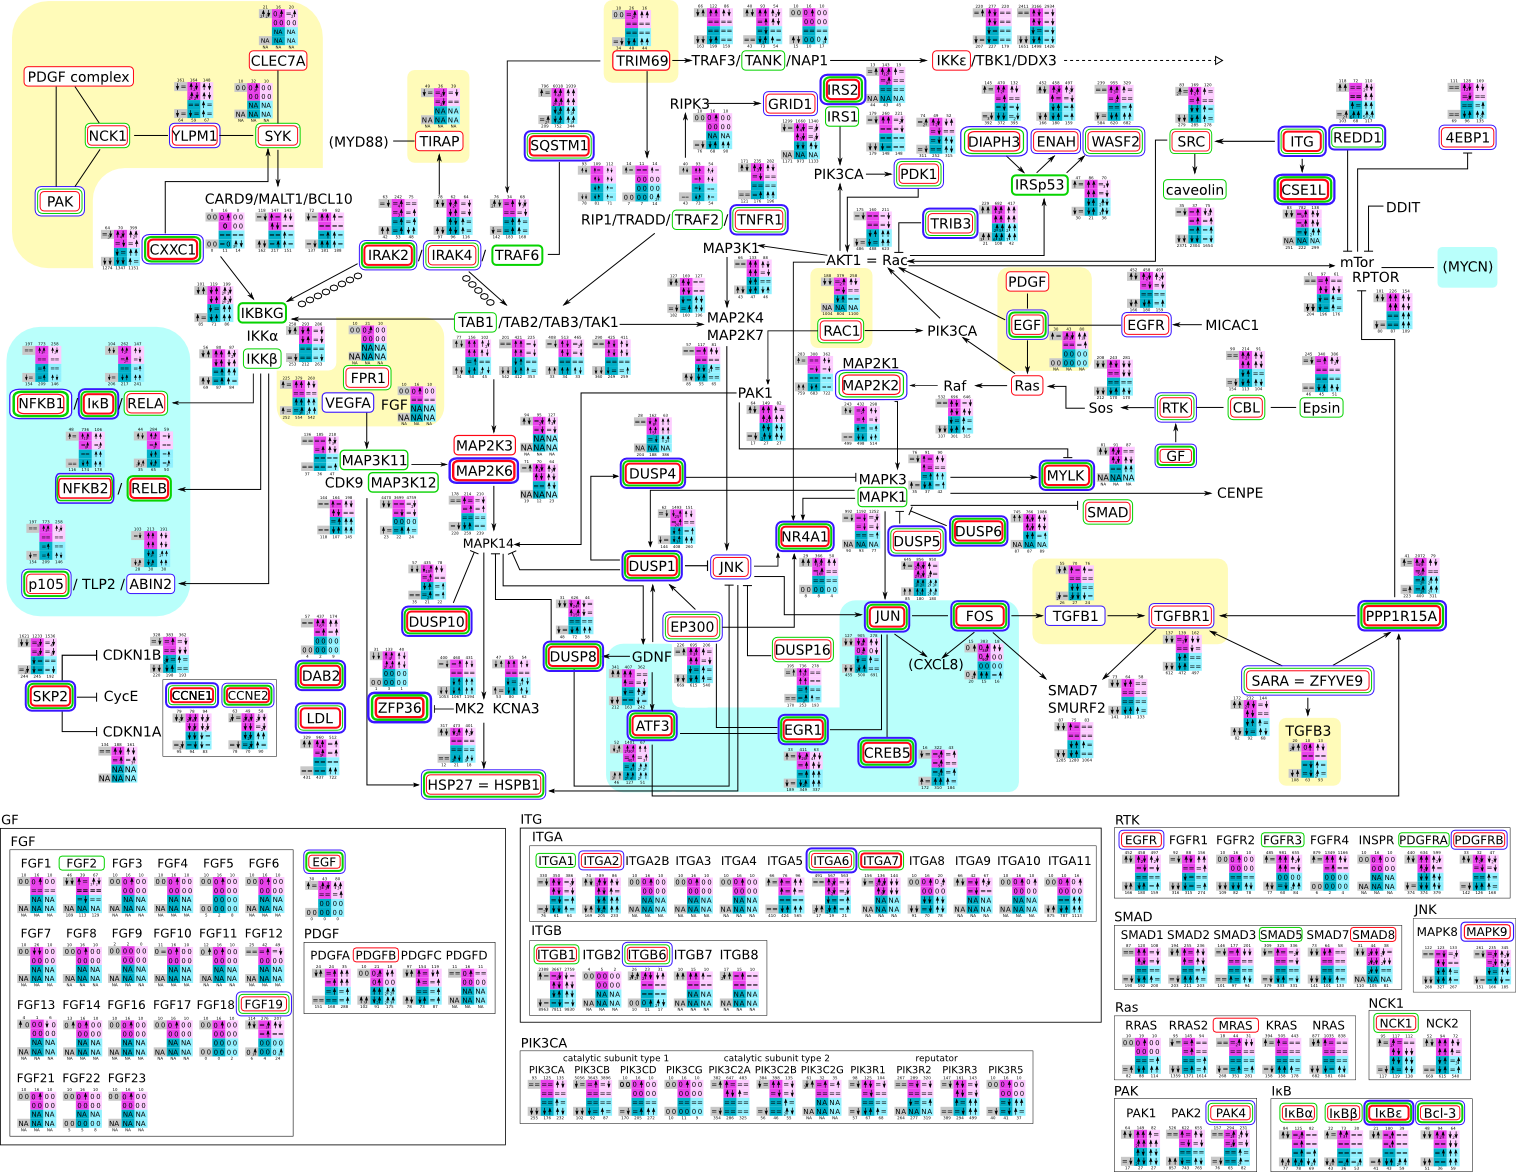 |
||||
| Mitogen-activated protein kinase (MAPK) svg pdf and description |
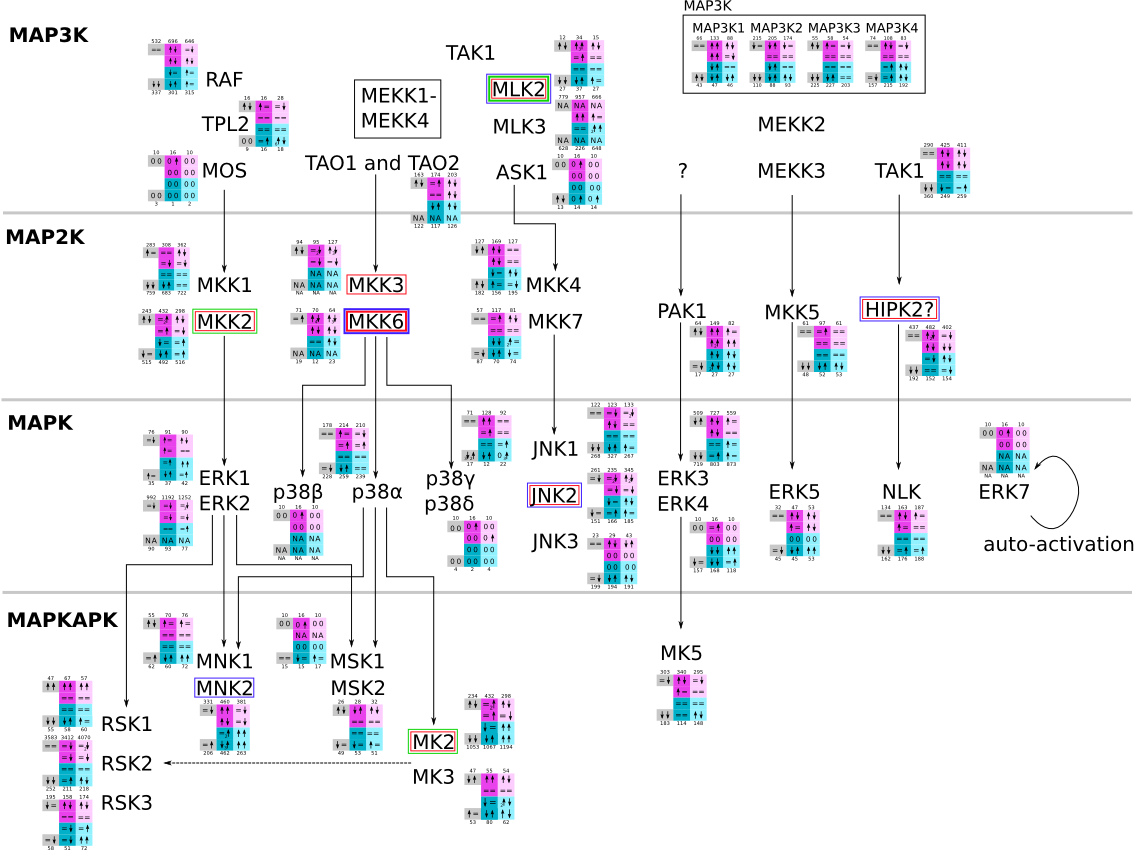 |
Activation of MAPKs svg pdf and description |
 |
MAPK (p38) svg pdf and description |
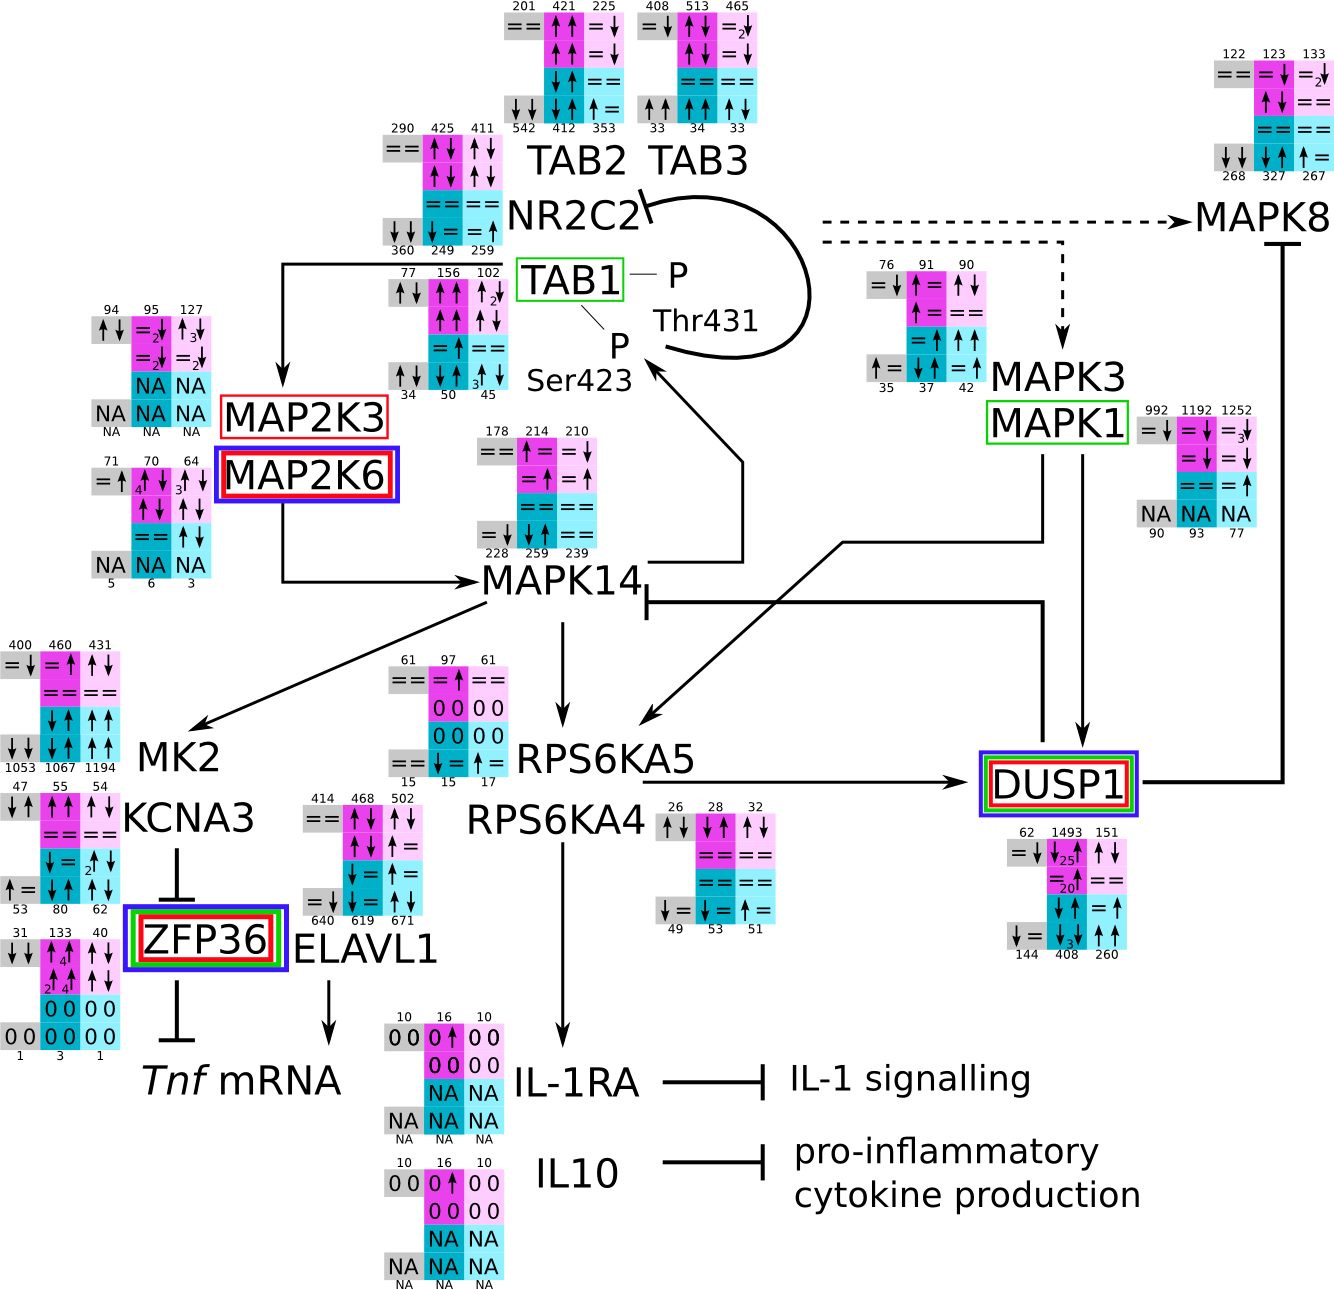 |
| MAPK and cell migration (JNK) svg pdf and description |
 |
MAPK and cell migration (ERK) svg pdf and description |
 |
MAPK and cell migration (P38) svg pdf and description |
 |
| Pathway induced by RNA-virus svg pdf and description |
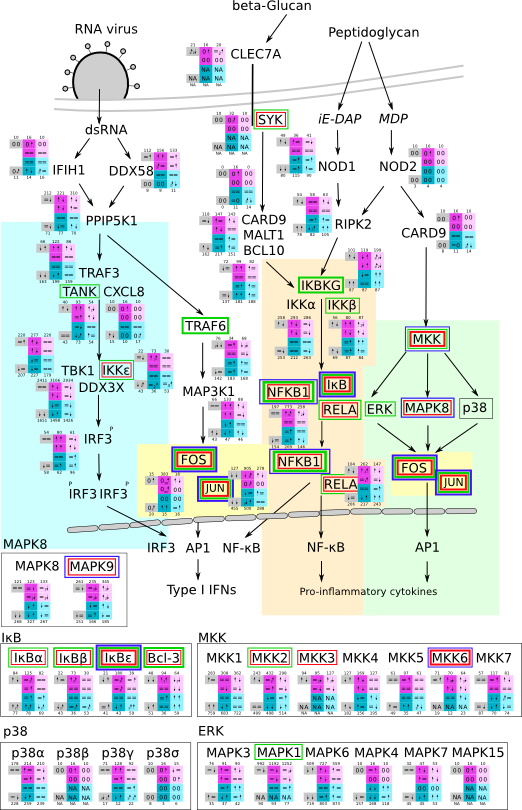 |
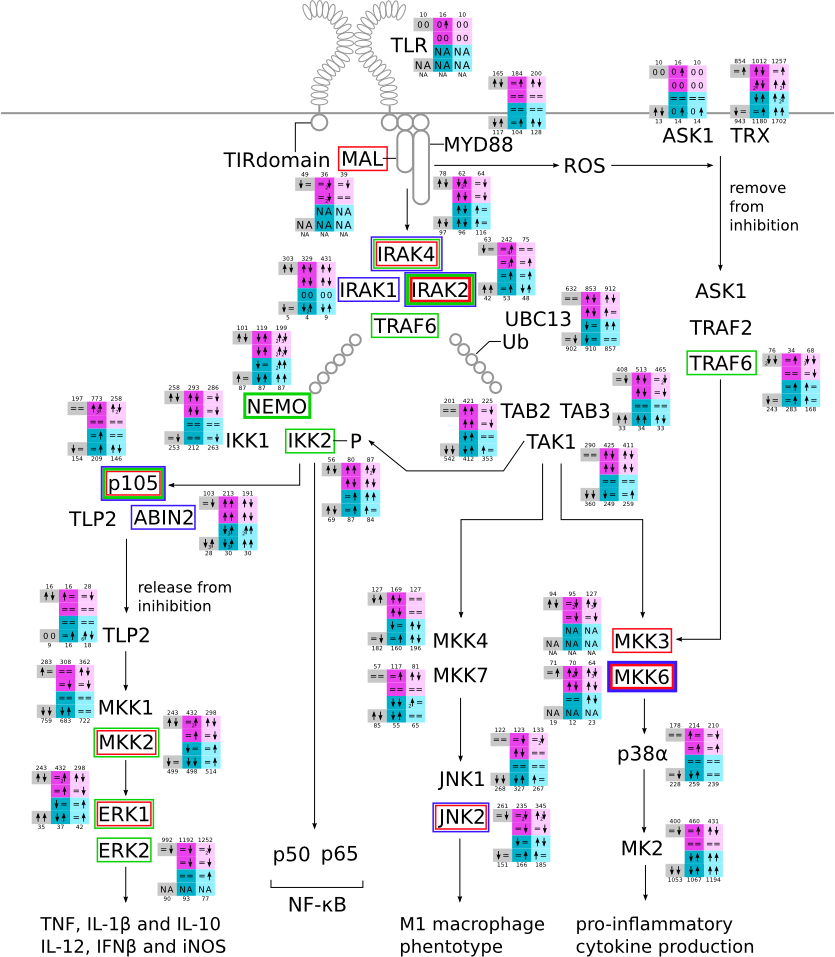
Pathway for general immune response svg pdf and description |
 |
NFκB activation by viruses svg pdf and description |
 |
| Viral interactions with nucleocytoplasmic transport pathways svg pdf and description |
 |
Unfolded protein response within the endoplasmatic reticulum svg pdf and description |
 |
Cell cycle during Epstein-Barr virus infection svg pdf and description |
 |
| Herpes simplex infection svg pdf and description |
 |
MyD88 svg pdf and description |
 |
CREB initiation svg pdf and description |
 |
| NFκB svg pdf and description |
 |
Focal adhesion svg pdf and description |
 |
Actin pathway svg pdf and description |
 |
| GADD34 svg pdf and description |
 |
DUSP svg pdf and description |
 |
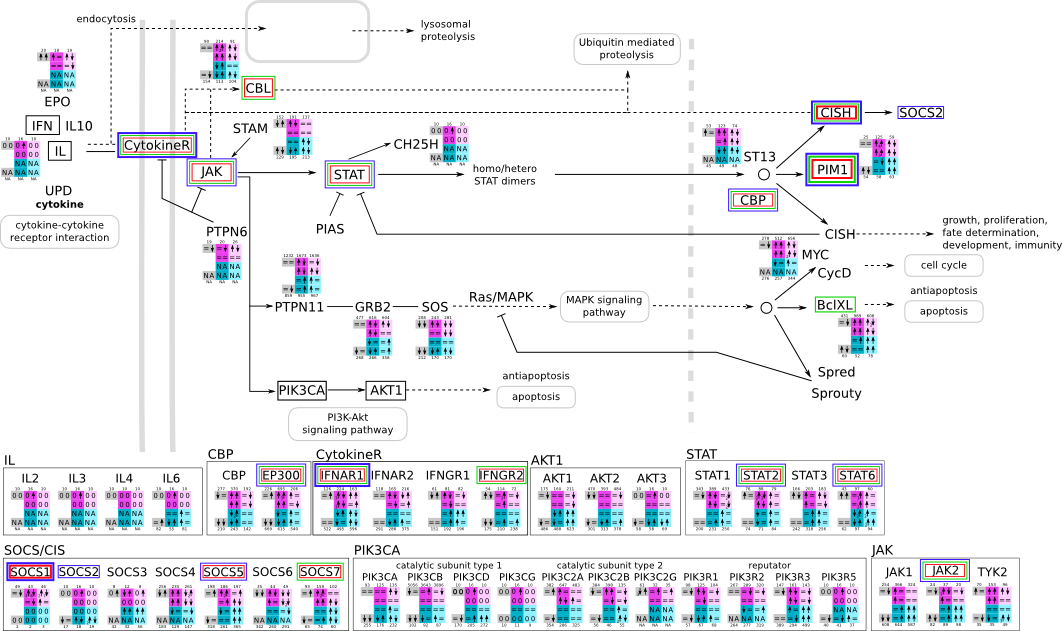
JAK/STAT svg pdf and description |
 |
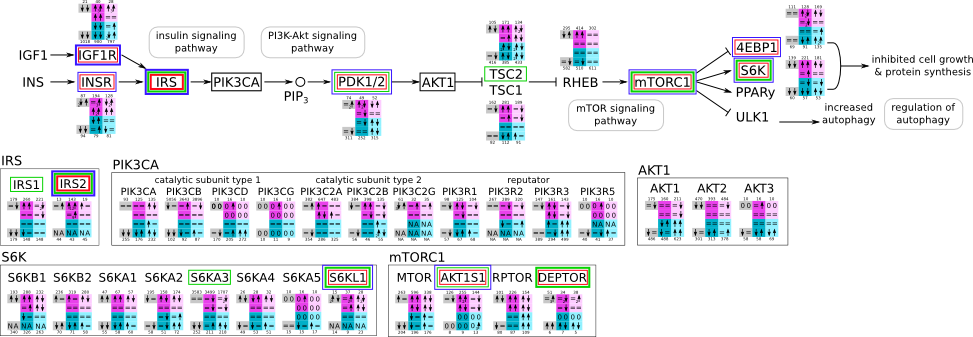
| Insulin svg pdf and description |
 |
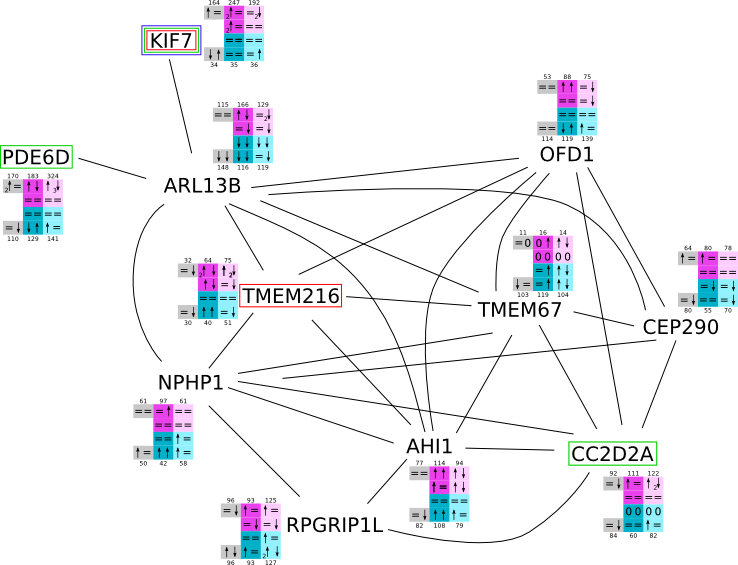
ARL13B svg pdf and description |
 |
Endocytosis svg pdf and description |
 |
| mTor svg pdf and description |
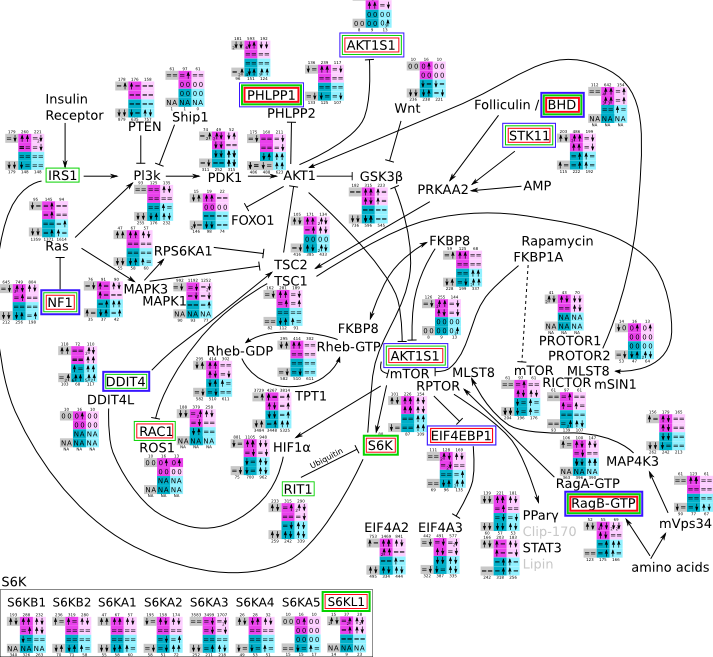 |
PI3K Akt svg pdf and description |
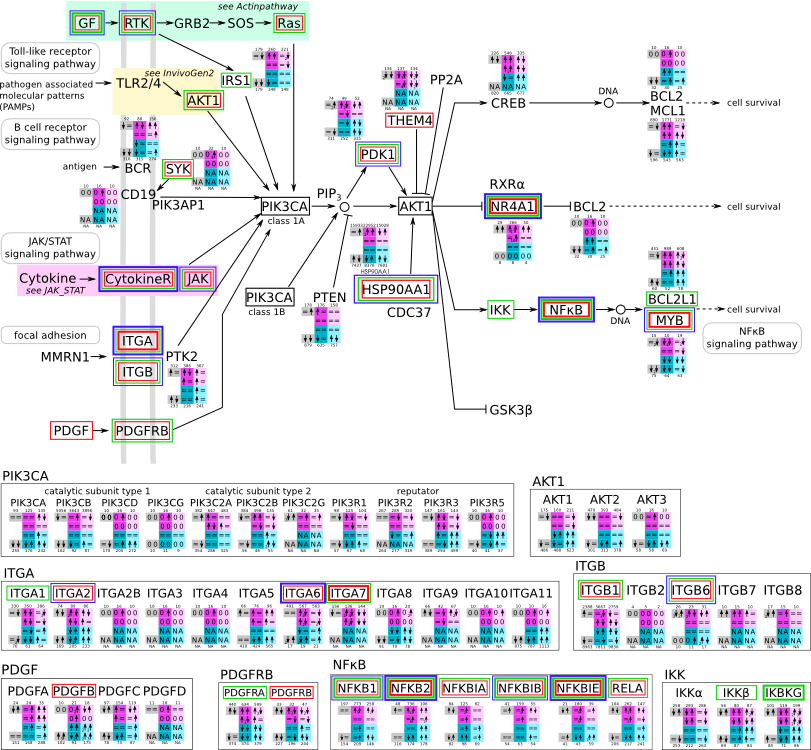 |
PI3K NFκB svg pdf and description |
 |
| TGF-B interactions svg pdf and description |
 |
RIP3/RIP1-mediated necrosis svg pdf and description |
 |
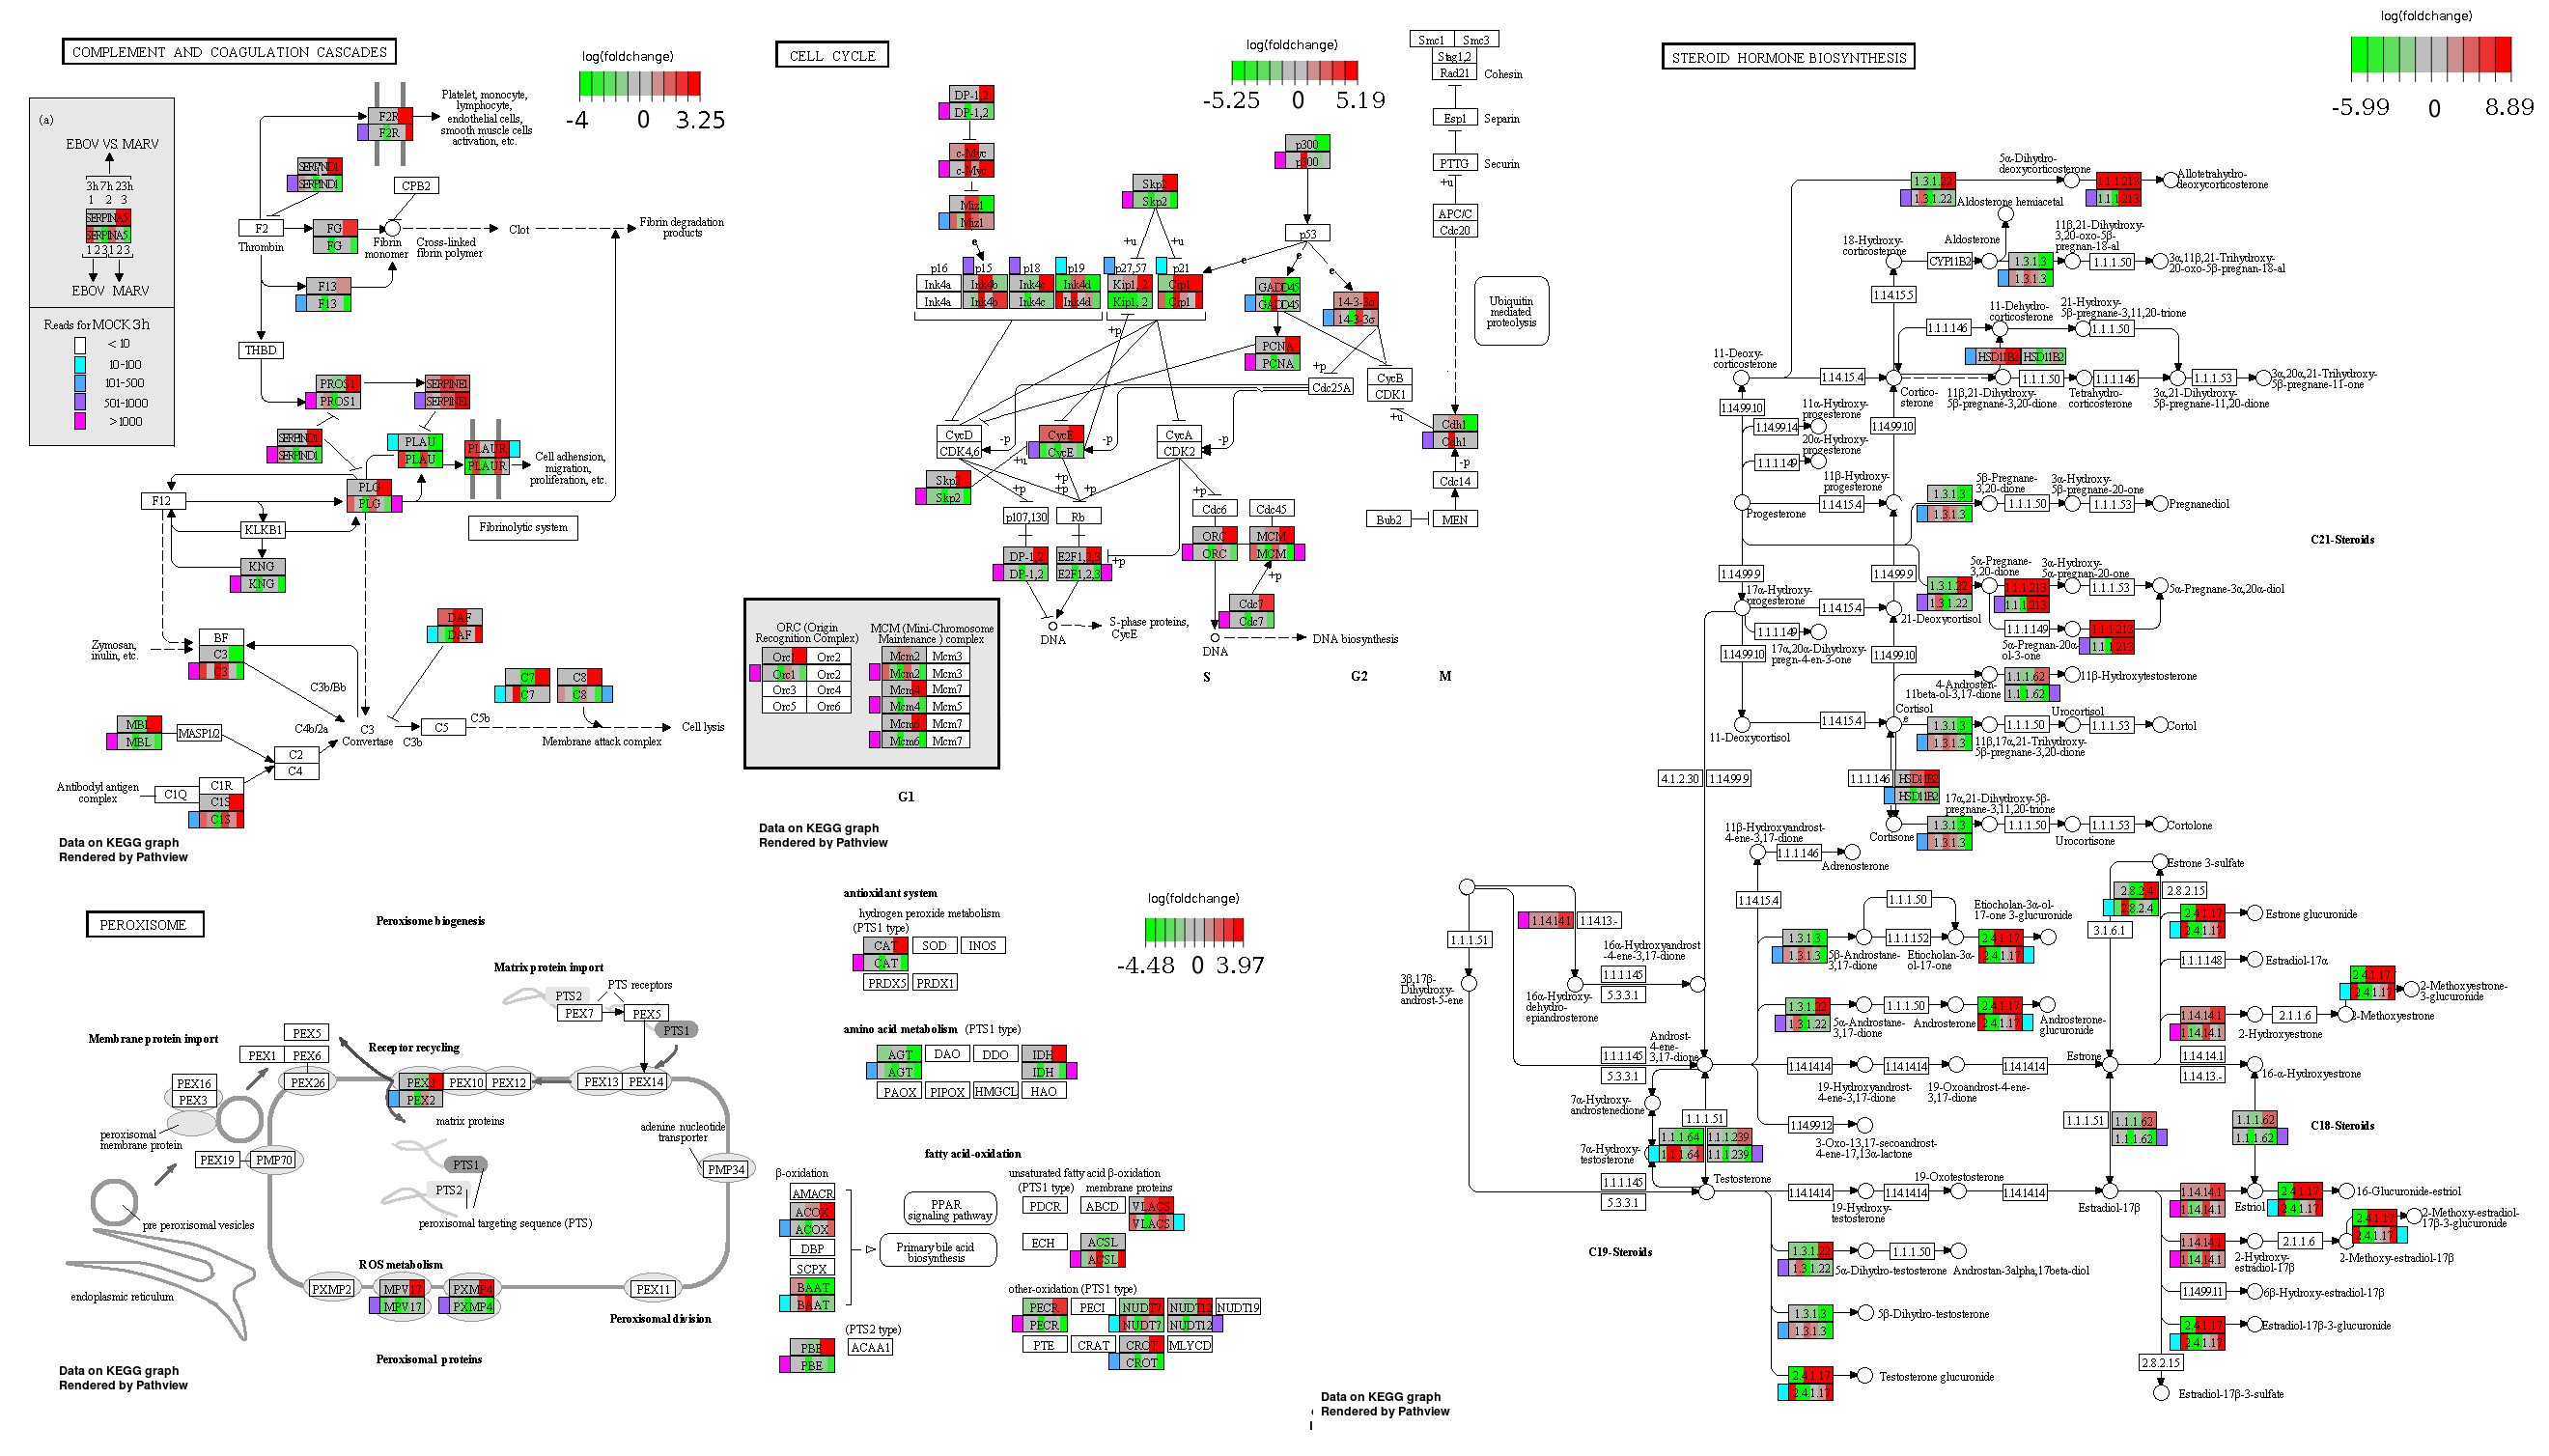
Cell cycle, Peroxisome, Steroid biosynthesis, complement and coagulation cascades svg pdf and description |
 |
| Endocytosis svg pdf and description |
|
Apoptosis svg pdf and description |
 |
||
ES 7: qRT-PCR
qRT-PCR were performed for the human and bat homologous genes HAVCR1, NPC1 and TLR3. Please note that for the qRT-PCR new samples from an similar infection experiment of the same cell lines were used. We noticed that the infection rate was lower as in the cells used within the transcriptome study.
ES 7A: Primer Design
ES 7B: qRT-PCR values and 18S normalized mRNA abundances
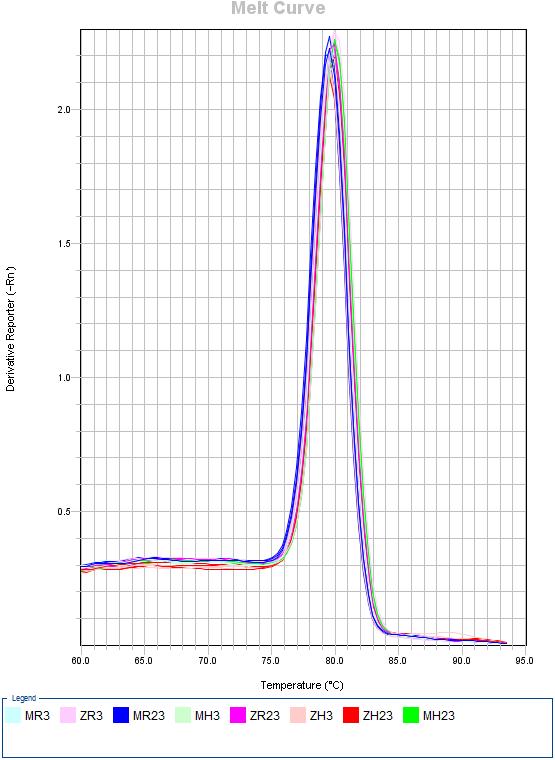
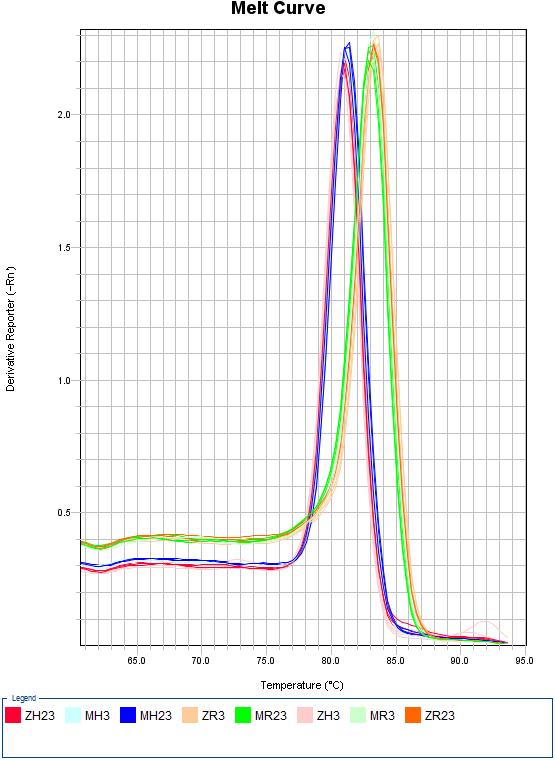
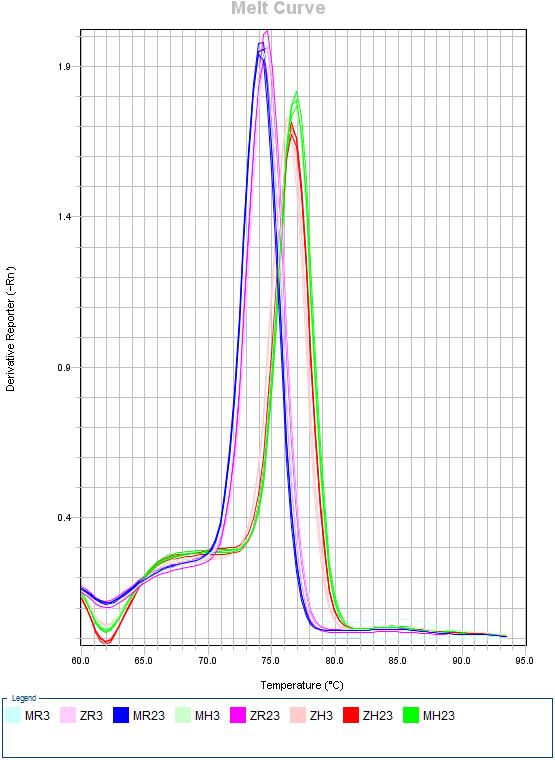
Download EXCELES 7C: Melting curves
- H. sapines: MH3 = Mock 3h | MH23 = Mock 23h | ZH3 = ZEBOV 3h | ZH23 = ZEBOV 23h
- R. aegyptiacus: MR3 = Mock 3h | MR23 = Mock 23h | ZR3 = ZEBOV 3h | ZR23 = ZEBOV 23h
| NPC1 | HAVCR1 | TLR3 |
 |
 |
 |
ES 7D: Agarose gel
2% agarose gel in TAE was run in 120V for 35 minutes. (-): control; water
On first gel, primer for bat HAVCR1 did not amplify. HAVCR1 was rerun on a second gel.


ES 7E: IFA
We repeated the infection of HuH7 and R06E-J cells and isolated RNA for qRT-PCR analyses. An IFA of these cells revealed that the infection rates were lower than in the previous experiment used for RNA-Seq.
