CHAC1
| Name | Synonyms | Full Name | RefSeq ID | Description (.pdf) | IGV-img (humangenome) | Sashimi-img (humangenome) | UCSC-img (humangenome) | IGV-img (batgenome) |
|---|---|---|---|---|---|---|---|---|
| CHAC1 | BOTCH, NM_001142776, NP_001136248, Q9BUX1-2,MGC4504 | ChaC glutathione-specific gamma-glutamylcyclotransferase 1 | NM_024111 |  |
 |
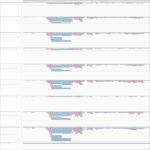 |
Download all snapshots for IGV, UCSC and Sashimi (zip archive)
Description
ChaC, cation transport regulator homolog 1 (E. coli) (CHAC1), transcript variant 2 is a negative regulator of Notch signaling pathway and is involved in embryonic neurogenesis: it acts by inhibiting Notch cleavage by furin, maintaining Notch in an immature inactive form, thereby promoting neurogenesis in embryos. It may also act as a pro-apoptotic component of the unfolded protein response pathway by mediating the pro-apoptotic effects of the ATF4-ATF3-DDIT3/CHOP cascade.
Cation transport regulator-like protein 1 (CHAC1) is activated by chemical unfolded protein response inducers, via the \gene{ATF4-\update (C/EBO homologous protein) and not the parallel XBP1 or ATF6 pathways. In turn \update regulates a variety of downstream target genes and may enhance apoptosis [Mungrue et al., J Immunol, 2009, 182:466-476].
Only very transcripts mapped to this gene locus within the human cells, whereas in the bats differential expression could be observed. There expression increased with the infection time. This accounts especially for the infected cells.
Maximum read counts and DESeq normalized read counts for human and bat cell lines
| Source | Species | Mapping on | Mock3h | Mock7h | Mock23h | EBOV3h | EBOV7h | EBOV23h | MARV3h | MARV7h | MARV23h | |
|---|---|---|---|---|---|---|---|---|---|---|---|---|
Read_Max | H. sapiens | Genome | 10 | 15 | 19 | 8 | 22 | 3 | 13 | 18 | 17 | |
Read_Max | R. aegyptiacus | Transcriptome | 23 | 30 | 161 | 122 | 117 | 219 | 14 | 139 | 307 | |
Read_Max | R. aegyptiacus | Genome | 31 | 104 | 125 | 23 | 92 | 103 | 14 | 148 | 321 | |
DESeq | H. sapiens | Genome | 40.58 | 108.09 | 83.4 | 44.35 | 83.92 | 8.9 | 58.02 | 88.93 | 139.09 | |
DESeq | R. aegyptiacus | Transcriptome | 97.62 | 132.62 | 507.94 | 411.22 | 425.89 | 643.87 | 62.18 | 357.1 | 797.86 | |
DESeq | R. aegyptiacus | Genome | 239.77 | 825.07 | 958.45 | 231.07 | 918.58 | 1540.38 | 186.67 | 800.88 | 1470.08 |