TFE3
| Name | Synonyms | Full Name | RefSeq ID | Description (.pdf) | IGV-img (humangenome) | Sashimi-img (humangenome) | UCSC-img (humangenome) | IGV-img (batgenome) |
|---|---|---|---|---|---|---|---|---|
| TFE3 | TFE3, RCCP2, RCCX1, TFEA, bHLHe33,TFEA | transcription factor binding to IGHM enhancer 3 | NM_006521 |  |
 |
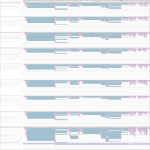 |
Download all snapshots for IGV, UCSC and Sashimi (zip archive)
Description
This gene encodes a basic helix-loop-helix domain-containing transcription factor that binds MUE3-type E-box sequences in the promoter of genes. The encoded protein promotes the expression of genes downstream of transforming growth factor beta (TGF-beta) signaling. This gene may be involved in chromosomal translocations in renal cell carcinomas and other cancers, resulting in the production of fusion proteins. Translocation partners include PRCC (papillary renal cell carcinoma), NONO (non-POU domain containing, octamer-binding), and ASPSCR1 (alveolar soft part sarcoma chromosome region, candidate 1), among other genes.
Its expression is boosted in human cells cells due to Ebola and Marburg virus infection. For bat cells samples this can be only observed for Marburg infected cultures.
Maximum read counts and DESeq normalized read counts for human and bat cell lines
| Source | Species | Mapping on | Mock3h | Mock7h | Mock23h | EBOV3h | EBOV7h | EBOV23h | MARV3h | MARV7h | MARV23h | |
|---|---|---|---|---|---|---|---|---|---|---|---|---|
Read_Max | H. sapiens | Genome | 230 | 325 | 229 | 221 | 407 | 1414 | 309 | 621 | 399 | |
Read_Max | R. aegyptiacus | Transcriptome | 127 | 87 | 175 | 131 | 96 | 153 | 72 | 157 | 318 | |
Read_Max | R. aegyptiacus | Genome | 115 | 130 | 132 | 82 | 82 | 82 | 48 | 158 | 277 | |
DESeq | H. sapiens | Genome | 3929.24 | 4042.76 | 3296.18 | 3491.49 | 3559.29 | 13479.99 | 3556.31 | 5159.21 | 5352.92 | |
DESeq | R. aegyptiacus | Transcriptome | 857.94 | 805.21 | 1669.62 | 980.77 | 924.16 | 1327.81 | 688.47 | 869.35 | 2022.45 | |
DESeq | R. aegyptiacus | Genome | 1179.08 | 1348.04 | 2056.38 | 1187.94 | 1334.9 | 1984.22 | 998.58 | 1159.29 | 2542.03 |