PPM1H
| Name | Synonyms | Full Name | RefSeq ID | Description (.pdf) | IGV-img (humangenome) | Sashimi-img (humangenome) | UCSC-img (humangenome) | IGV-img (batgenome) |
|---|---|---|---|---|---|---|---|---|
| PPM1H | KIAA1157, FLJ13253, NERPP-2C | protein phosphatase, Mg2+/Mn2+ dependent, 1H | NM_020700 |  |
NONE | 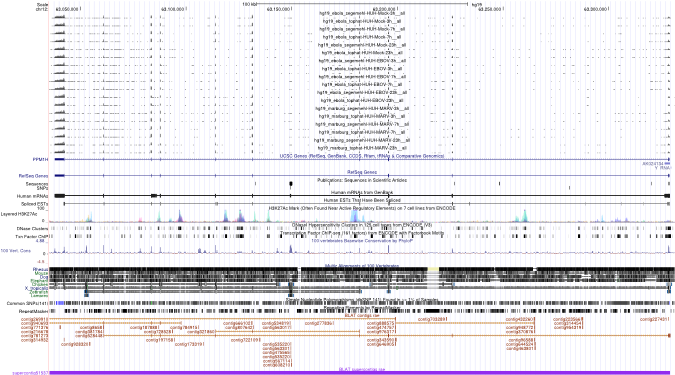 |
 |
Download all snapshots for IGV, UCSC and Sashimi (zip archive)
Description
Protein phosphatase. Interesting profile in marburg infected cells.
Maximum read counts and DESeq normalized read counts for human and bat cell lines
| Source | Species | Mapping on | Mock3h | Mock7h | Mock23h | EBOV3h | EBOV7h | EBOV23h | MARV3h | MARV7h | MARV23h | |
|---|---|---|---|---|---|---|---|---|---|---|---|---|
Read_Max | H. sapiens | Genome | 257 | 233 | 289 | 265 | 276 | 127 | 256 | 244 | 187 | |
Read_Max | R. aegyptiacus | Transcriptome | 42 | 40 | 64 | 43 | 45 | 61 | 37 | 60 | 80 | |
Read_Max | R. aegyptiacus | Genome | 85 | 67 | 50 | 58 | 57 | 44 | 50 | 98 | 92 | |
DESeq | H. sapiens | Genome | 7489.11 | 6464.95 | 7583.2 | 6332.93 | 5972.12 | 2522.31 | 5722.13 | 4853.06 | 5415.99 | |
DESeq | R. aegyptiacus | Transcriptome | 343.78 | 330.49 | 725.37 | 435.94 | 464.22 | 620.78 | 352.52 | 457.89 | 576.56 | |
DESeq | R. aegyptiacus | Genome | 1697.3 | 2027.07 | 2663.36 | 1679.71 | 2080.47 | 2631.71 | 1752.02 | 1941.92 | 2319.42 |