POLR2A
| Name | Synonyms | Full Name | RefSeq ID | Description (.pdf) | IGV-img (humangenome) | Sashimi-img (humangenome) | UCSC-img (humangenome) | IGV-img (batgenome) |
|---|---|---|---|---|---|---|---|---|
| POLR2A | Polymerase II,POLRA, RPB1 | polymerase (RNA) II (DNA directed) polypeptide A, 220kDa | NM_000937 |  |
 |
 |
Download all snapshots for IGV, UCSC and Sashimi (zip archive)
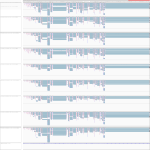
Description
Polymerase II gene. Interesting alternative splicing profiles. Expression pattern seem different within treatments.
Maximum read counts and DESeq normalized read counts for human and bat cell lines
| Source | Species | Mapping on | Mock3h | Mock7h | Mock23h | EBOV3h | EBOV7h | EBOV23h | MARV3h | MARV7h | MARV23h | |
|---|---|---|---|---|---|---|---|---|---|---|---|---|
Read_Max | H. sapiens | Genome | 403 | 407 | 255 | 340 | 409 | 803 | 459 | 574 | 230 | |
Read_Max | R. aegyptiacus | Transcriptome | 229 | 170 | 220 | 190 | 168 | 220 | 114 | 209 | 249 | |
Read_Max | R. aegyptiacus | Genome | 225 | 186 | 173 | 161 | 143 | 122 | 94 | 259 | 270 | |
DESeq | H. sapiens | Genome | 13824.43 | 13694.83 | 8531.35 | 13180.45 | 10710.0 | 22490.11 | 13808.2 | 13545.99 | 7603.73 | |
DESeq | R. aegyptiacus | Transcriptome | 5430.83 | 4846.25 | 6089.14 | 4618.72 | 3952.08 | 5056.74 | 3561.81 | 4360.08 | 4162.86 | |
DESeq | R. aegyptiacus | Genome | 5543.07 | 4637.35 | 5765.22 | 5263.29 | 4003.57 | 5166.81 | 3618.74 | 4277.15 | 4120.85 |