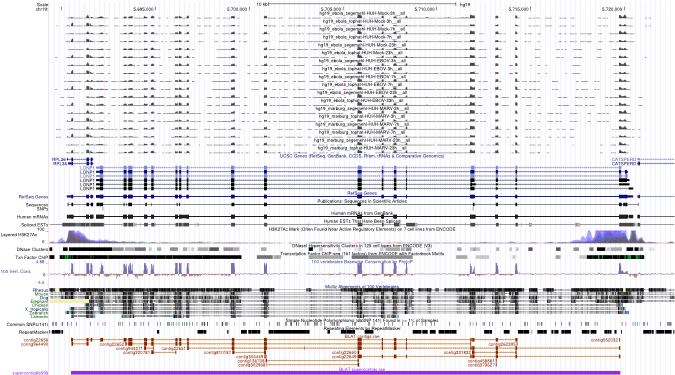
LONP1
| Name | Synonyms | Full Name | RefSeq ID | Description (.pdf) | IGV-img (humangenome) | Sashimi-img (humangenome) | UCSC-img (humangenome) | IGV-img (batgenome) |
|---|---|---|---|---|---|---|---|---|
| LONP1 | LonHS, hLON, PIM1 | lon peptidase 1, mitochondrial | NM_004793 |  |
 |
 |
Download all snapshots for IGV, UCSC and Sashimi (zip archive)
Description
This protein mediates the selective degradation of misfolded, unassembled or oxidatively damaged polypeptides in the mitochondrial matrix. The expression pattern within treatments is interesting.
Maximum read counts and DESeq normalized read counts for human and bat cell lines
| Source | Species | Mapping on | Mock3h | Mock7h | Mock23h | EBOV3h | EBOV7h | EBOV23h | MARV3h | MARV7h | MARV23h | |
|---|---|---|---|---|---|---|---|---|---|---|---|---|
Read_Max | H. sapiens | Genome | 157 | 178 | 215 | 164 | 214 | 500 | 202 | 254 | 190 | |
Read_Max | R. aegyptiacus | Transcriptome | 153 | 163 | 114 | 161 | 165 | 206 | 124 | 151 | 241 | |
Read_Max | R. aegyptiacus | Genome | 154 | 167 | 99 | 146 | 140 | 129 | 107 | 182 | 276 | |
DESeq | H. sapiens | Genome | 2957.07 | 3256.43 | 3302.14 | 3305.56 | 2846.33 | 8325.52 | 3190.52 | 3609.27 | 3617.52 | |
DESeq | R. aegyptiacus | Transcriptome | 1825.79 | 2147.69 | 2018.98 | 1910.17 | 1862.65 | 2712.36 | 1902.1 | 1760.0 | 2276.99 | |
DESeq | R. aegyptiacus | Genome | 2098.63 | 2145.72 | 2164.61 | 2561.53 | 2057.03 | 3006.36 | 2142.23 | 1981.57 | 2491.52 |