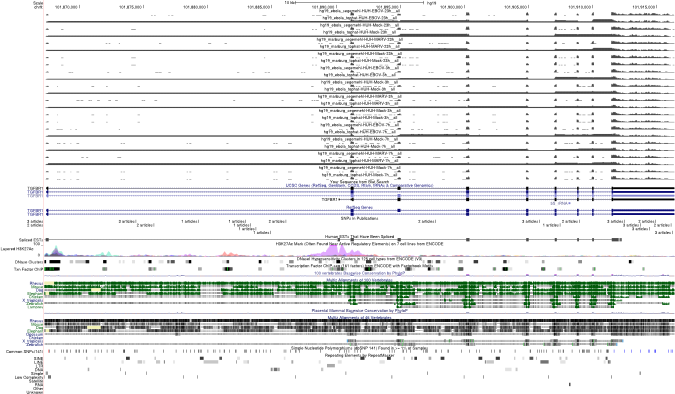
TGFBR1
| Name | Synonyms | Full Name | RefSeq ID | Description (.pdf) | IGV-img (humangenome) | Sashimi-img (humangenome) | UCSC-img (humangenome) | IGV-img (batgenome) |
|---|---|---|---|---|---|---|---|---|
| TGFBR1 | ALK-5, ACVRLK4 | transforming growth factor, beta receptor 1 |  |
 |
 |
Download all snapshots for IGV, UCSC and Sashimi (zip archive)
Description
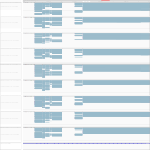
Maximum read counts and DESeq normalized read counts for human and bat cell lines
| Source | Species | Mapping on | Mock3h | Mock7h | Mock23h | EBOV3h | EBOV7h | EBOV23h | MARV3h | MARV7h | MARV23h | |
|---|---|---|---|---|---|---|---|---|---|---|---|---|
Read_Max | H. sapiens | Genome | 137 | 115 | 97 | 134 | 139 | 68 | 162 | 108 | 91 | |
Read_Max | R. aegyptiacus | Transcriptome | 612 | 472 | 245 | 382 | 316 | 468 | 497 | 463 | 423 | |
Read_Max | R. aegyptiacus | Genome | 828 | 389 | 290 | 554 | 258 | 291 | 444 | 569 | 474 | |
DESeq | H. sapiens | Genome | 2868.79 | 2303.87 | 2448.31 | 2957.65 | 2504.08 | 1430.09 | 2843.14 | 1867.48 | 2293.13 | |
DESeq | R. aegyptiacus | Transcriptome | 5114.09 | 4026.6 | 3205.09 | 3860.54 | 3910.47 | 4723.11 | 5980.18 | 4031.24 | 3587.31 | |
DESeq | R. aegyptiacus | Genome | 11407.54 | 8872.21 | 7220.2 | 9826.45 | 9561.92 | 12199.06 | 15019.25 | 9604.95 | 8877.0 |