PPP1R15A
| Name | Synonyms | Full Name | RefSeq ID | Description (.pdf) | IGV-img (humangenome) | Sashimi-img (humangenome) | UCSC-img (humangenome) | IGV-img (batgenome) |
|---|---|---|---|---|---|---|---|---|
| PPP1R15A | GADD34, | protein phosphatase 1, regulatory subunit 15A | NM_014330 |  |
 |
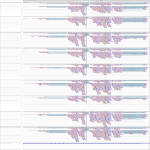 |
Download all snapshots for IGV, UCSC and Sashimi (zip archive)
Description
This gene is a member of a group of genes whose transcript levels are increased following stressful growth arrest conditions and treatment with DNA-damaging agents. The induction of this gene by ionizing radiation occurs in certain cell lines regardless of p53 status, and its protein response is correlated with apoptosis following ionizing radiation.
This gene is 50 fold enriched exclusively in Ebola infected cells in human cells after 23 h.
Maximum read counts and DESeq normalized read counts for human and bat cell lines
| Source | Species | Mapping on | Mock3h | Mock7h | Mock23h | EBOV3h | EBOV7h | EBOV23h | MARV3h | MARV7h | MARV23h | |
|---|---|---|---|---|---|---|---|---|---|---|---|---|
Read_Max | H. sapiens | Genome | 33 | 41 | 40 | 39 | 46 | 2072 | 57 | 79 | 67 | |
Read_Max | R. aegyptiacus | Transcriptome | 174 | 163 | 223 | 183 | 174 | 400 | 122 | 246 | 311 | |
Read_Max | R. aegyptiacus | Genome | 221 | 183 | 198 | 186 | 145 | 264 | 101 | 285 | 339 | |
DESeq | H. sapiens | Genome | 384.59 | 439.55 | 397.14 | 498.34 | 432.68 | 20549.13 | 592.24 | 695.64 | 737.13 | |
DESeq | R. aegyptiacus | Transcriptome | 1523.33 | 1600.35 | 2657.84 | 1598.84 | 1813.37 | 4179.04 | 1289.17 | 1819.48 | 2732.72 | |
DESeq | R. aegyptiacus | Genome | 1778.08 | 1741.4 | 2808.41 | 2003.6 | 2101.68 | 4747.78 | 1443.9 | 2037.87 | 2984.68 |