JAK2
| Name | Synonyms | Full Name | RefSeq ID | Description (.pdf) | IGV-img (humangenome) | Sashimi-img (humangenome) | UCSC-img (humangenome) | IGV-img (batgenome) |
|---|---|---|---|---|---|---|---|---|
| JAK2 | JTK10, THCYT3 | Janus kinase 2 |  |
 |
 |
Download all snapshots for IGV, UCSC and Sashimi (zip archive)
Description
This gene product is a protein tyrosine kinase involved in a specific subset of cytokine receptor signaling pathways. It has been found to be constituitively associated with the prolactin receptor and is required for responses to gamma interferon. Mice that do not express an active protein for this gene exhibit embryonic lethality associated with the absence of definitive erythropoiesis.
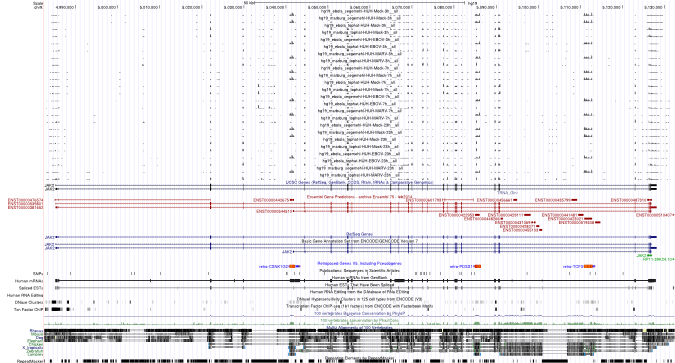
This gene is lowly expressed in human cells, but higher expressed in bat cells. There are several strongly expressed retrogenes within the intronic regions of human cells gene.
Maximum read counts and DESeq normalized read counts for human and bat cell lines
| Source | Species | Mapping on | Mock3h | Mock7h | Mock23h | EBOV3h | EBOV7h | EBOV23h | MARV3h | MARV7h | MARV23h | |
|---|---|---|---|---|---|---|---|---|---|---|---|---|
Read_Max | H. sapiens | Genome | 24 | 21 | 13 | 17 | 37 | 24 | 20 | 19 | 16 | |
Read_Max | R. aegyptiacus | Transcriptome | 64 | 64 | 54 | 82 | 62 | 89 | 54 | 80 | 98 | |
Read_Max | R. aegyptiacus | Genome | 100 | 106 | 59 | 60 | 67 | 50 | 59 | 102 | 139 | |
DESeq | H. sapiens | Genome | 366.32 | 322.26 | 228.36 | 339.78 | 326.99 | 401.04 | 273.81 | 240.01 | 347.86 | |
DESeq | R. aegyptiacus | Transcriptome | 1140.23 | 1048.47 | 1275.06 | 1357.1 | 1280.07 | 1761.53 | 1093.38 | 1312.19 | 1629.71 | |
DESeq | R. aegyptiacus | Genome | 1496.2 | 1672.04 | 1616.76 | 1413.09 | 1651.88 | 2147.4 | 1443.9 | 1671.53 | 2086.54 |