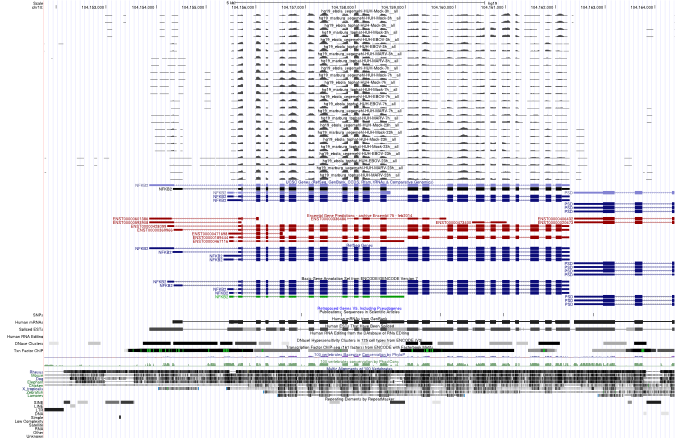
NFKB2
| Name | Synonyms | Full Name | RefSeq ID | Description (.pdf) | IGV-img (humangenome) | Sashimi-img (humangenome) | UCSC-img (humangenome) | IGV-img (batgenome) |
|---|---|---|---|---|---|---|---|---|
| NFKB2 | Nuclear Factor Of Kappa Light Polypeptide Gene Enhancer In B-Cells 2, Oncogene Lyt-10, H2TF1,LYT-10, p52, p105, NF-kB2 | nuclear factor of kappa light polypeptide gene enhancer in B-cells 2 (p49/p100) |  |
 |
 |
Download all snapshots for IGV, UCSC and Sashimi (zip archive)
Description
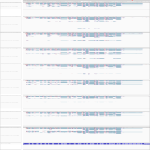
Maximum read counts and DESeq normalized read counts for human and bat cell lines
| Source | Species | Mapping on | Mock3h | Mock7h | Mock23h | EBOV3h | EBOV7h | EBOV23h | MARV3h | MARV7h | MARV23h | |
|---|---|---|---|---|---|---|---|---|---|---|---|---|
Read_Max | H. sapiens | Genome | 31 | 46 | 48 | 32 | 61 | 736 | 55 | 67 | 106 | |
Read_Max | R. aegyptiacus | Transcriptome | 116 | 122 | 110 | 103 | 93 | 174 | 72 | 127 | 178 | |
Read_Max | R. aegyptiacus | Genome | 133 | 108 | 96 | 123 | 79 | 103 | 62 | 159 | 202 | |
DESeq | H. sapiens | Genome | 340.95 | 483.4 | 474.58 | 444.73 | 467.63 | 7508.34 | 436.09 | 565.34 | 1306.9 | |
DESeq | R. aegyptiacus | Transcriptome | 1157.87 | 1065.72 | 1461.96 | 917.58 | 934.02 | 1779.49 | 913.17 | 945.36 | 1588.6 | |
DESeq | R. aegyptiacus | Genome | 1556.36 | 1209.31 | 1841.03 | 1463.45 | 1247.84 | 2266.19 | 1171.76 | 1221.93 | 2050.58 |