NAPA
| Name | Synonyms | Full Name | RefSeq ID | Description (.pdf) | IGV-img (humangenome) | Sashimi-img (humangenome) | UCSC-img (humangenome) | IGV-img (batgenome) |
|---|---|---|---|---|---|---|---|---|
| NAPA | N-ethylmaleimide-sensitive factor attachment protein, alpha | NM_003827 |  |
 |
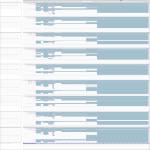 |
Download all snapshots for IGV, UCSC and Sashimi (zip archive)
Description
This gene encodes a member of the soluble NSF attachment protein (SNAP) family. SNAP proteins play a critical role in the docking and fusion of vesicles to target membranes as part of the 20S NSF-SNAP-SNARE complex. The encoded protein plays a role in the completion of membrane fusion by mediating the interaction of N-ethylmaleimide-sensitive factor (NSF) with the vesicle-associated and membrane-associated SNAP receptor (SNARE) complex, and stimulating the ATPase activity of NSF. Alternatively spliced transcript variants have been observed for this gene.
It is constantly expressed in both human cells and bat cells under all investigated conditions.
Maximum read counts and DESeq normalized read counts for human and bat cell lines
| Source | Species | Mapping on | Mock3h | Mock7h | Mock23h | EBOV3h | EBOV7h | EBOV23h | MARV3h | MARV7h | MARV23h | |
|---|---|---|---|---|---|---|---|---|---|---|---|---|
Read_Max | H. sapiens | Genome | 132 | 191 | 177 | 154 | 249 | 318 | 197 | 266 | 166 | |
Read_Max | R. aegyptiacus | Transcriptome | 150 | 156 | 154 | 156 | 148 | 225 | 127 | 155 | 248 | |
Read_Max | R. aegyptiacus | Genome | 200 | 186 | 155 | 166 | 146 | 158 | 134 | 257 | 312 | |
DESeq | H. sapiens | Genome | 1114.22 | 1247.28 | 1128.85 | 1337.88 | 1340.74 | 2601.26 | 1336.11 | 1387.07 | 1178.6 | |
DESeq | R. aegyptiacus | Transcriptome | 807.53 | 853.32 | 1005.1 | 769.25 | 877.07 | 1284.18 | 908.72 | 835.47 | 1084.76 | |
DESeq | R. aegyptiacus | Genome | 1466.98 | 1413.75 | 1812.02 | 1613.55 | 1571.52 | 2835.35 | 1695.79 | 1434.44 | 1845.95 |