RAB11A
| Name | Synonyms | Full Name | RefSeq ID | Description (.pdf) | IGV-img (humangenome) | Sashimi-img (humangenome) | UCSC-img (humangenome) | IGV-img (batgenome) |
|---|---|---|---|---|---|---|---|---|
| RAB11A | YL8 | RAB11A, member RAS oncogene family |  |
 |
 |
 |
Download all snapshots for IGV, UCSC and Sashimi (zip archive)
Description
The protein encoded by this gene belongs to the Rab family of the small GTPase superfamily. It is associated with both constitutive and regulated secretory pathways, and may be involved in protein transport. Two transcript variants encoding different isoforms have been found for this gene.
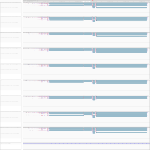
RAB11A is highly expressed in human cells and the homolog in bat cells is as well, although expression is a bit higher in human cells in comparison to bat cells. No significant variances were observed after virus infection.
Maximum read counts and DESeq normalized read counts for human and bat cell lines
| Source | Species | Mapping on | Mock3h | Mock7h | Mock23h | EBOV3h | EBOV7h | EBOV23h | MARV3h | MARV7h | MARV23h | |
|---|---|---|---|---|---|---|---|---|---|---|---|---|
Read_Max |  | H. sapiens | Genome | 534 | 557 | 475 | 562 | 620 | 717 | 710 | 675 | 584 |
Read_Max |  | R. aegyptiacus | Transcriptome | 357 | 329 | 222 | 296 | 235 | 287 | 240 | 372 | 372 |
Read_Max |  | R. aegyptiacus | Genome | 396 | 304 | 186 | 308 | 205 | 169 | 211 | 451 | 417 |
DESeq | | H. sapiens | Genome | 4272.24 | 3704.16 | 4006.05 | 4418.87 | 3721.06 | 3127.63 | 4253.69 | 3575.7 | 4170.98 |
DESeq | | R. aegyptiacus | Transcriptome | 1251.13 | 1269.95 | 1162.68 | 1417.54 | 1266.92 | 1217.46 | 1339.22 | 1433.65 | 1383.91 |
DESeq | | R. aegyptiacus | Genome | 2248.16 | 2519.92 | 1972.7 | 2310.71 | 2455.49 | 2131.73 | 2489.71 | 2626.24 | 2350.25 |