FLT1
| Name | Synonyms | Full Name | RefSeq ID | Description (.pdf) | IGV-img (humangenome) | Sashimi-img (humangenome) | UCSC-img (humangenome) | IGV-img (batgenome) |
|---|---|---|---|---|---|---|---|---|
| FLT1 | FLT1, FLT, FLT-1, VEGFR-1, VEGFR1,VEGFR1 | fms-related tyrosine kinase 1 | NM_002019 |  |
NONE | 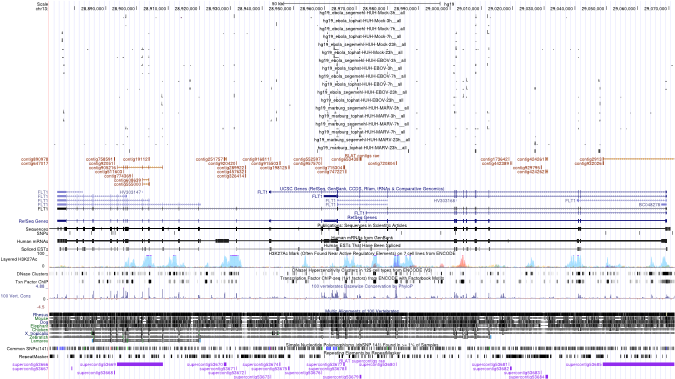 |
 |
Download all snapshots for IGV, UCSC and Sashimi (zip archive)
Description
This gene encodes a member of the vascular endothelial growth factor receptor (VEGFR) family. VEGFR family members are receptor tyrosine kinases (RTKs) which contain an extracellular ligand-binding region with seven immunoglobulin (Ig)-like domains, a transmembrane segment, and a tyrosine kinase (TK) domain within the cytoplasmic domain. This protein binds to VEGFR-A, VEGFR-B and placental growth factor and plays an important role in angiogenesis and vasculogenesis. Expression of this receptor is found in vascular endothelial cells, placental trophoblast cells and peripheral blood monocytes.
FLT1 is not expressed in human cells on no homolog was found in bat cells transcript assemblies. %%%%%%%%%%%%%%%%%%%%%%%%%%%%%%%%%%%%%%%%%%%%%%%%%%%%%%%%%%%%%%
\ucscfigure{ \beginfigure[H] \centering \includegraphics[width=\textwidth]../../input/holy_folders/hg19.goi.01116/snapshots//hg19.goi.01116_ucsc.eps % \caption\ucsc of gene FLT1. % <- say something about the figure here \endfigure }
\setcounterfigure0 \enddocument
Maximum read counts and DESeq normalized read counts for human and bat cell lines
| Source | Species | Mapping on | Mock3h | Mock7h | Mock23h | EBOV3h | EBOV7h | EBOV23h | MARV3h | MARV7h | MARV23h | |
|---|---|---|---|---|---|---|---|---|---|---|---|---|
Read_Max | H. sapiens | Genome | 3 | 2 | 3 | 4 | 3 | 3 | 4 | 2 | 1 | |
Read_Max | R. aegyptiacus | Transcriptome | 590 | 533 | 236 | 371 | 295 | 343 | 333 | 393 | 395 | |
Read_Max | R. aegyptiacus | Genome | 710 | 383 | 201 | 558 | 243 | 212 | 318 | 475 | 437 | |
DESeq | H. sapiens | Genome | 4.04 | 7.12 | 16.89 | 13.55 | 12.38 | 7.58 | 10.65 | 8.99 | 2.09 | |
DESeq | R. aegyptiacus | Transcriptome | 7300.14 | 7099.13 | 4289.82 | 5059.15 | 5172.01 | 6269.34 | 6118.12 | 4671.56 | 5217.76 | |
DESeq | R. aegyptiacus | Genome | 13491.56 | 8475.19 | 7094.11 | 13635.17 | 8781.74 | 9577.79 | 11922.29 | 7859.68 | 8306.77 |