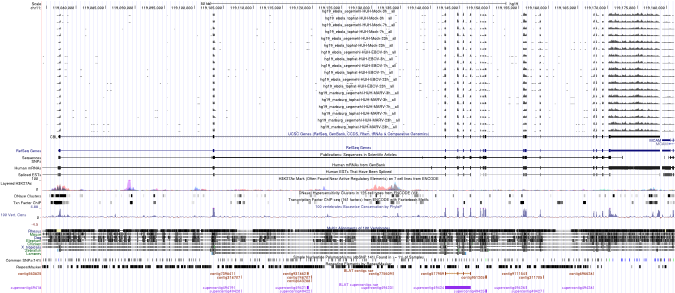
CBL
| Name | Synonyms | Full Name | RefSeq ID | Description (.pdf) | IGV-img (humangenome) | Sashimi-img (humangenome) | UCSC-img (humangenome) | IGV-img (batgenome) |
|---|---|---|---|---|---|---|---|---|
| CBL | Cbl Proto-Oncogene, E3 Ubiquitin Protein Ligase, RING Finger Protein 55, CBL2, C-CBL,RNF55, c-Cbl | Cbl proto-oncogene, E3 ubiquitin protein ligase | NM_005188 |  |
 |
 |
Download all snapshots for IGV, UCSC and Sashimi (zip archive)
Description
This gene is a proto-oncogene that encodes a RING finger E3 ubiquitin ligase. The encoded protein is one of the enzymes required for targeting substrates for degradation by the proteasome. This protein mediates the transfer of ubiquitin from ubiquitin conjugating enzymes (E2) to specific substrates. This protein also contains an N-terminal phosphotyrosine binding domain that allows it to interact with numerous tyrosine-phosphorylated substrates and target them for proteasome degradation. As such it functions as a negative regulator of many signal transduction pathways. This gene has been found to be mutated or translocated in many cancers including acute myeloid leukaemia. Mutations in this gene are also the cause of Noonan syndrome-like disorder.
Expression in all samples.
Maximum read counts and DESeq normalized read counts for human and bat cell lines
| Source | Species | Mapping on | Mock3h | Mock7h | Mock23h | EBOV3h | EBOV7h | EBOV23h | MARV3h | MARV7h | MARV23h | |
|---|---|---|---|---|---|---|---|---|---|---|---|---|
Read_Max | H. sapiens | Genome | 79 | 90 | 80 | 76 | 98 | 214 | 70 | 91 | 73 | |
Read_Max | R. aegyptiacus | Transcriptome | 146 | 101 | 96 | 154 | 82 | 113 | 82 | 104 | 85 | |
Read_Max | R. aegyptiacus | Genome | 149 | 157 | 89 | 108 | 67 | 104 | 87 | 143 | 124 | |
DESeq | H. sapiens | Genome | 3293.98 | 3203.4 | 3347.81 | 2953.09 | 3408.89 | 7351.74 | 2691.39 | 2675.63 | 3546.84 | |
DESeq | R. aegyptiacus | Transcriptome | 1829.15 | 1289.92 | 1465.62 | 1721.54 | 1541.79 | 1740.99 | 1363.7 | 1398.94 | 981.55 | |
DESeq | R. aegyptiacus | Genome | 4683.68 | 4377.24 | 3786.95 | 3756.39 | 4044.87 | 5328.68 | 4238.36 | 3937.77 | 3603.71 |