TSG101
| Name | Synonyms | Full Name | RefSeq ID | Description (.pdf) | IGV-img (humangenome) | Sashimi-img (humangenome) | UCSC-img (humangenome) | IGV-img (batgenome) |
|---|---|---|---|---|---|---|---|---|
| TSG101 | VPS23 | tumor susceptibility 101 | NM_006292 |  |
 |
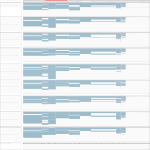 |
Download all snapshots for IGV, UCSC and Sashimi (zip archive)
Description
The protein encoded by this gene belongs to a group of apparently inactive homologs of ubiquitin-conjugating enzymes. The gene product contains a coiled-coil domain that interacts with stathmin, a cytosolic phosphoprotein implicated in tumorigenesis. The protein may play a role in cell growth and differentiation and act as a negative growth regulator. In vitro steady-state expression of this tumor susceptibility gene appears to be important for maintenance of genomic stability and cell cycle regulation. Mutations and alternative splicing in this gene occur in high frequency in breast cancer and suggest that defects occur during breast cancer tumorigenesis and/or progression. Component of the ESCRT-I complex, a regulator of vesicular trafficking process. Binds to ubiquitinated cargo proteins and is required for the sorting of endocytic ubiquitinated cargos into multivesicular bodies (MVBs). Mediates the association between the ESCRT-0 and ESCRT-I complex. Required for completion of cytokinesis; the function requires CEP55. May be involved in cell growth and differentiation. Acts as a negative growth regulator. Involved in the budding of many viruses through an interaction with viral proteins that contain a late-budding motif P-[ST]-A-P. This interaction is essential for viral particle budding of numerous retroviruses (uniprot). Expression of TSG101 is slightly upregulated 23 hours after Ebola infection in Hu7, but not in bat. In contrast, the gene is slightly upregulated in bat 23 hours after infection with Marburg virus, but not in Hu7. There might be an intronic transcript between exons 7 and 8 (only detected by one mapper).
Maximum read counts and DESeq normalized read counts for human and bat cell lines
| Source | Species | Mapping on | Mock3h | Mock7h | Mock23h | EBOV3h | EBOV7h | EBOV23h | MARV3h | MARV7h | MARV23h | |
|---|---|---|---|---|---|---|---|---|---|---|---|---|
Read_Max | H. sapiens | Genome | 93 | 136 | 101 | 85 | 156 | 193 | 127 | 200 | 99 | |
Read_Max | R. aegyptiacus | Transcriptome | 170 | 173 | 153 | 276 | 288 | 212 | 161 | 283 | 217 | |
Read_Max | R. aegyptiacus | Genome | 185 | 256 | 126 | 153 | 211 | 114 | 131 | 332 | 230 | |
DESeq | H. sapiens | Genome | 852.41 | 876.05 | 878.66 | 894.15 | 957.03 | 1262.97 | 931.71 | 875.49 | 957.87 | |
DESeq | R. aegyptiacus | Transcriptome | 1213.32 | 1260.87 | 1415.54 | 1550.31 | 1663.35 | 1601.13 | 1454.91 | 1549.31 | 1395.29 | |
DESeq | R. aegyptiacus | Genome | 1650.03 | 1846.36 | 1789.71 | 1610.59 | 1983.37 | 1947.67 | 1820.62 | 1937.96 | 1714.1 |