FKBP8
| Name | Synonyms | Full Name | RefSeq ID | Description (.pdf) | IGV-img (humangenome) | Sashimi-img (humangenome) | UCSC-img (humangenome) | IGV-img (batgenome) |
|---|---|---|---|---|---|---|---|---|
| FKBP8 | FKBP38, FKBPr38 | FK506 binding protein 8, 38kDa | NM_012181 |  |
 |
 |
Download all snapshots for IGV, UCSC and Sashimi (zip archive)
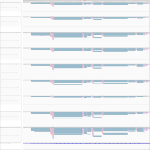
Description
FK506 binding protein 8: Constitutively inactive PPiase, which becomes active when bound to calmodulin and calcium. Seems to act as a chaperone for BCL2, targets it to the mitochondria and modulates its phosphorylation state. The BCL2/FKBP8/calmodulin/calcium complex probably interferes with the binding of BCL2 to its targets. The active form of FKBP8 may therefore play a role in the regulation of apoptosis. (Source: Uniprot) No particular expression differences in human on the conditions tested. It seems slightly upregulated in bat during Marburg infection.
Maximum read counts and DESeq normalized read counts for human and bat cell lines
| Source | Species | Mapping on | Mock3h | Mock7h | Mock23h | EBOV3h | EBOV7h | EBOV23h | MARV3h | MARV7h | MARV23h | |
|---|---|---|---|---|---|---|---|---|---|---|---|---|
Read_Max | H. sapiens | Genome | 45 | 49 | 59 | 45 | 80 | 125 | 68 | 62 | 63 | |
Read_Max | R. aegyptiacus | Transcriptome | 228 | 199 | 224 | 183 | 182 | 156 | 97 | 217 | 337 | |
Read_Max | R. aegyptiacus | Genome | 255 | 188 | 189 | 203 | 149 | 97 | 82 | 266 | 384 | |
DESeq | H. sapiens | Genome | 455.62 | 456.88 | 515.28 | 481.23 | 513.97 | 953.73 | 478.2 | 481.41 | 687.12 | |
DESeq | R. aegyptiacus | Transcriptome | 873.07 | 1279.03 | 1535.25 | 1087.9 | 1089.52 | 1067.32 | 755.21 | 1024.67 | 1823.02 | |
DESeq | R. aegyptiacus | Genome | 1256.43 | 1309.7 | 1913.56 | 1820.92 | 1324.85 | 1493.39 | 1062.68 | 1308.36 | 2263.77 |