LIMK2
| Name | Synonyms | Full Name | RefSeq ID | Description (.pdf) | IGV-img (humangenome) | Sashimi-img (humangenome) | UCSC-img (humangenome) | IGV-img (batgenome) |
|---|---|---|---|---|---|---|---|---|
| LIMK2 | LIM domain kinase 2 | NM_016733 |  |
 |
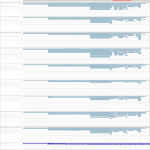 |
Download all snapshots for IGV, UCSC and Sashimi (zip archive)
Description
There are approximately 40 known eukaryotic LIM proteins, so named for the LIM domains they contain. LIM domains are highly conserved cysteine-rich structures containing 2 zinc fingers. Although zinc fingers usually function by binding to DNA or RNA, the LIM motif probably mediates protein-protein interactions. LIM kinase-1 and LIM kinase-2 belong to a small subfamily with a unique combination of 2 N-terminal LIM motifs and a C-terminal protein kinase domain. The protein encoded by this gene is phosphorylated and activated by ROCK, a downstream effector of Rho, and the encoded protein, in turn, phosphorylates cofilin, inhibiting its actin-depolymerizing activity. It is thought that this pathway contributes to Rho-induced reorganization of the actin cytoskeleton. The gene is lowly and uniformly expressed in humans. The bat homolog is more highly expressed and downregulated in MARV.
Maximum read counts and DESeq normalized read counts for human and bat cell lines
| Source | Species | Mapping on | Mock3h | Mock7h | Mock23h | EBOV3h | EBOV7h | EBOV23h | MARV3h | MARV7h | MARV23h | |
|---|---|---|---|---|---|---|---|---|---|---|---|---|
Read_Max | H. sapiens | Genome | 23 | 22 | 17 | 26 | 23 | 28 | 34 | 30 | 27 | |
Read_Max | R. aegyptiacus | Transcriptome | 128 | 131 | 86 | 90 | 84 | 63 | 63 | 103 | 110 | |
Read_Max | R. aegyptiacus | Genome | 127 | 116 | 91 | 135 | 73 | 36 | 67 | 143 | 120 | |
DESeq | H. sapiens | Genome | 442.43 | 343.68 | 409.05 | 549.67 | 409.91 | 544.48 | 572.06 | 427.05 | 688.2 | |
DESeq | R. aegyptiacus | Transcriptome | 1010.01 | 1362.53 | 1222.54 | 856.23 | 897.88 | 575.87 | 764.11 | 949.49 | 878.33 | |
DESeq | R. aegyptiacus | Genome | 1862.3 | 1559.78 | 2208.12 | 2356.14 | 1685.36 | 1281.91 | 1566.47 | 1648.53 | 1540.29 |