RAB14
| Name | Synonyms | Full Name | RefSeq ID | Description (.pdf) | IGV-img (humangenome) | Sashimi-img (humangenome) | UCSC-img (humangenome) | IGV-img (batgenome) |
|---|---|---|---|---|---|---|---|---|
| RAB14 | FBP, RAB-14 | RAB14, member RAS oncogene family | NM_016322 |  |
 |
 |
Download all snapshots for IGV, UCSC and Sashimi (zip archive)
Description
RAB14 belongs to the large RAB family of low molecular mass GTPases that are involved in intracellular membrane trafficking. These proteins act as molecular switches that flip between an inactive GDP-bound state and an active GTP-bound state in which they recruit downstream effector proteins onto membranes.
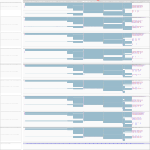
RAB14 is highly expressed in both human cells and in the bat cells homolog. There is a slight down-regulation in human cells infected cells after 23 h of Ebola and Marburg infection.
Maximum read counts and DESeq normalized read counts for human and bat cell lines
| Source | Species | Mapping on | Mock3h | Mock7h | Mock23h | EBOV3h | EBOV7h | EBOV23h | MARV3h | MARV7h | MARV23h | |
|---|---|---|---|---|---|---|---|---|---|---|---|---|
Read_Max | H. sapiens | Genome | 425 | 433 | 317 | 383 | 490 | 424 | 463 | 486 | 271 | |
Read_Max | R. aegyptiacus | Transcriptome | 1014 | 728 | 678 | 757 | 592 | 661 | 751 | 800 | 728 | |
Read_Max | R. aegyptiacus | Genome | 1150 | 802 | 598 | 726 | 492 | 402 | 665 | 1039 | 821 | |
DESeq | H. sapiens | Genome | 4231.65 | 4079.47 | 4265.18 | 4070.96 | 4287.69 | 3679.0 | 4037.02 | 3538.13 | 3896.96 | |
DESeq | R. aegyptiacus | Transcriptome | 3338.04 | 2665.98 | 3218.53 | 3204.01 | 2996.07 | 2892.01 | 3757.6 | 3153.81 | 2694.23 | |
DESeq | R. aegyptiacus | Genome | 9135.32 | 9288.39 | 8097.2 | 7204.68 | 8682.41 | 8264.55 | 11297.05 | 9542.31 | 7496.81 |