Pathway Enrichment Analysis
Pathway Enrichment Analysis of Differentially Expressed Genes in AgingSupplement Figure 4: Enriched pathway categories based on significantly differentially expressed genes (STab. 2) for each tissue and age comparison separately.
The numberof DEGs for each subplot and the total number of DEGs for this comparison are displayed on top of each subplot.
Any pathway with less than 5% of the genes being involved is summarized as others (grey). Brain and blood age similar, while skin and liver show specific aging patterns.
Most of the DEGs from liver are involved in metabolism. Note that not all age comparisons are included here, since they had too few DEGs for a sufficient pathway enrichment analysis.

Supplement Data 3A:
Pathway Enrichment Results for Differentially Expressed Genes: pathway_enrichment_results.xlsx
Supplement Data 3B:
Subdivision of Pathway Enrichment Categories: pathway_enrichment_results.xlsx
Pathway Enrichment Analysis of Temporal Expression Clusters
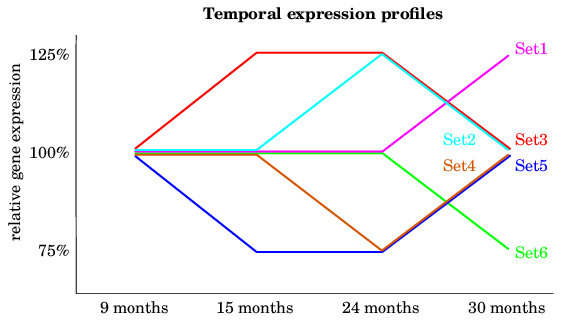
Supplement Figure 5A: Gene expression profiles of interest.All genes that followed the course of one the depicted expression changes during age were grouped
into separate clusters and analyzed subsequently for an enrichment of functional commonalities.
Supplement Data 5B:
Pathway Enrichment Results for different temporal profiles: temporal_enrichment_results.xlsx
