Differentially Expressed Genes During Aging
Supplement Data 2:Detailed gene expression profils for Blood DEGs
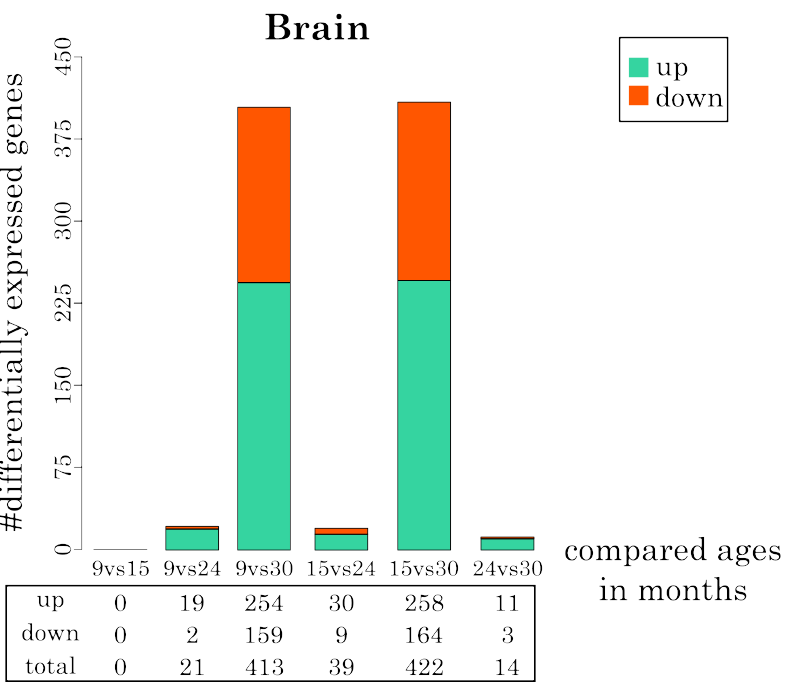
Detailed gene expression profils for Brain DEGs
Detailed gene expression profils for Liver DEGs
Detailed gene expression profils for Skin DEGs